It ‘tis the season to be jolly goes the old holiday carol and that has certainly been the case for small cap investors of late. After plunging deeper and then lagging their large cap brethren from the onset of Covid-19, small caps have coming roaring back. Relative outperformance has been especially strong since early November and YTD small cap returns of 18% now eclipse the S&P 500 return of 15%. Those are very solid returns for any year, and outstanding returns for a pandemic year! At Timber Point we had highlighted the rotation we saw occurring in the market in our quarterly update in early October suggesting a stronger weighting to small caps and we have been rewarded. The question now becomes, do we believe that small caps will continue to outperform as we move through 2021?
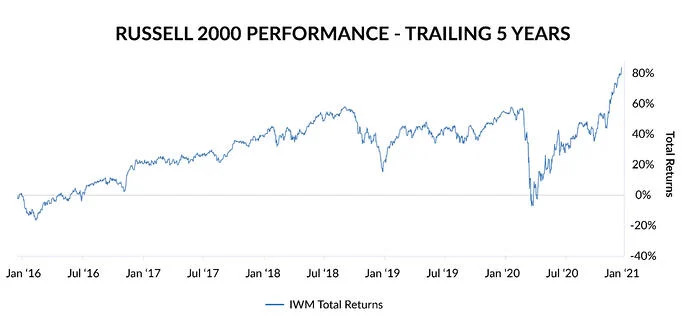
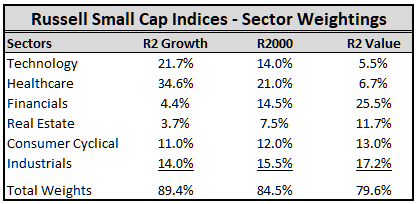
When we discuss small caps, we are referring to the Russell 2000 Index (R2K) which, as its name suggests, tracks the performance of ~ 2,000 names ranging from a few hundred million to a few billion dollars in market capitalization. Unlike its specific style counterparts, the Russell 2000 Growth (R2G) and Value (R2V) indices, the R2K is a broad representation of small caps that is void of influence from heavy sector concentration. As seen below, the R2G is heavily weighted toward the healthcare and technology sectors while the R2V has only a minor weighting in those sectors. On the flip side, the R2V is heavy on financials and REIT’s when compared to the R2G. As would be expected, the return profiles of the three small cap indices can be vastly different owing to their sector weightings as well as the differing valuation characteristics of stocks owned by each index. R2G has been the clear winner over the past decade having doubled up the annual return of the R2V. These differences make it essential we understand what small caps we are talking about! Sector weightings and returns for the R2K have essentially split the difference between the R2G and R2V.

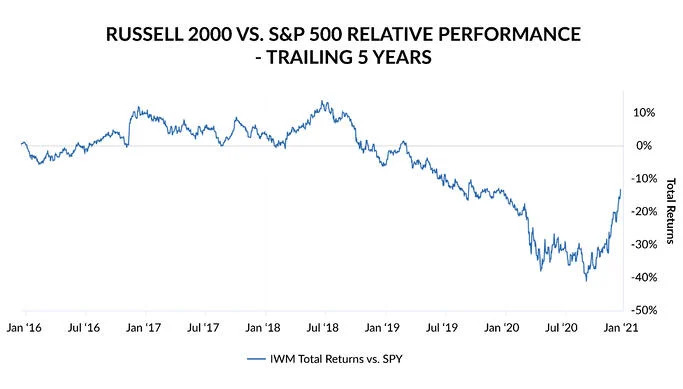
When viewing small caps as competitors for capital against their large cap counterparts, it is generally accepted that there is a small cap “premium”. That is to say that small caps have excess return, adjusted for risk, relative to large caps. Over the past 40 years, through 2019, that has not been the case as the Russell 2000 has returned 11.4% per annum compared to the Russell 1000 return of 12.0%. What’s more, small caps have exhibited greater volatility as measured by their standard deviation of returns. Small and large cap performance is correlated having averaged 0.8 since 1984 with a range of 0.6 to 0.96 on a one year rolling basis. That said, we have seen definite periods of small cap outperformance which have tended to occur early in economic recovery time periods. However, as can be seen below there are time periods of underperformance, as during the past 5 years. The biggest reason for the recent underperformance is the greater technology weighting in the S&P 500 Index as well as the strong performance of the FAANG+ names that have been largely responsible for propelling the S&P 500 to new highs. While the R2K index is also market cap weighted, it is at a distinct disadvantage in terms of the ability for only a few names to drive the index higher, it requires a broad-based move. Domestic large caps, with advantaged growth prospects, have been the place to be over the past decade and certainly the extraordinarily low interest rate environment has benefitted those secular growers.
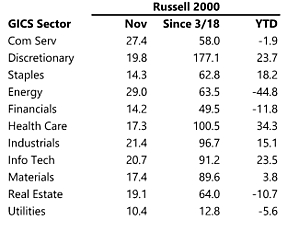
Looking forward, there is reason to believe the nascent outperformance from small caps since November can continue. As the economy recovers from the Covid-19 pandemic investor appetite should seek out names beyond the “work from home” favorites as investors adjust their portfolios to the new economic reality. Of course, this will require that vaccine manufacturing and the logistics of distributing it nationwide proceed without interruption. Sectors that have been hit the hardest by Covid-19 have started to lift in November – energy, commercial services and industrials were the top R2K performers in November. We would expect the entertainment/leisure, lodging, materials, and financial sectors to continue to benefit as many names are still trading below their pre-pandemic highs. Perhaps we are finally starting to see the answer to the question of “where will the money go when investors begin to move out of XYZ (pick any FAANG+ name)”.
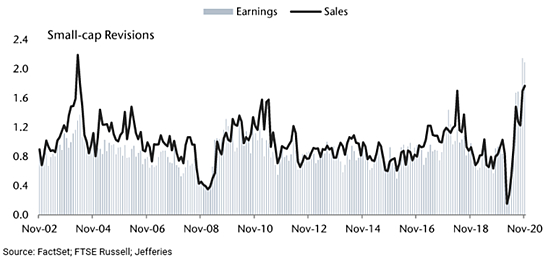
As mentioned, small caps have performed best after recessionary periods and we think that this will again be the case. While the recession was brief, but undoubtedly severe, small caps should benefit from a rebounding economy as they are more levered to the domestic economy than their larger counterparts. Recent analyst revisions to sales and earnings estimates are starting to incorporate a return to economic normalcy as consensus estimates now show low single digit growth in 2021 earnings for the R2K vs. 2019 levels. This is quite a turnaround from mid-summer when estimates showed a 15% decline in 2021 earnings vs. 2019. The Fed continues to be supportive and has been very clear that interest rate moves are off the table even as inflation moves past the prior 2% threshold. Chairman Powell’s wish for fiscal stimulus could be in the offing as Congress appears close to settling on an ~ $900 billion relief package to continue unemployment benefits and aid those workers and business that have been hardest hit by Covid-19. President elect Biden has called this stimulus package a “down payment” on a larger, more comprehensive stimulus plan he would pursue post inauguration. While the outcome of such a plan will likely depend on the two Senate races in Georgia in early 2021, there does appear to be a robust economic recovery in the offing that should be a tailwind for small caps.
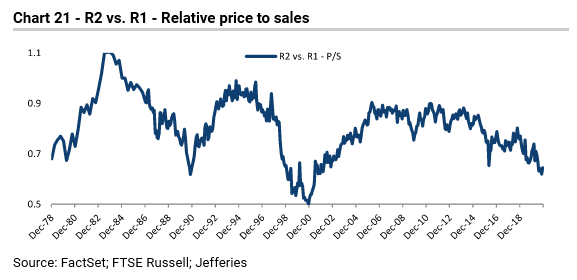
Finally, relative valuations between small and large caps have been stretched quite a bit and should return to more normal levels as more sectors benefit from the economic recovery or, alternatively, as technology becomes less a driver to large cap returns. As seen below, small caps are trading at a significant discount on a price/sales basis relative to large caps. Some of the differential reflects the impact of large cap technology in the Russell 1000 as their scale and network effect result in outsized profitability which investors have rewarded by bidding their share prices higher. Will this change? Certainly there has been an increasing drumbeat of potential regulatory measures against big tech including a Justice Department antitrust lawsuit against Alphabet (GOOG) and FTC antitrust lawsuit against Facebook (FB). To date, this has not stopped the stocks from performing but bears watching and could further provide the impetus for incremental investment dollars to seek out opportunities in other areas of the market.
Bottom line, risk appetite has broadened out into the small cap space as investors are eyeing the re-opening of the U.S. economy aided by encouraging vaccine news. It is reasonable to expect that the “winners” in the economy will start to shift away from technology names and to more sectors that have been hurt by Covid-19 and are still trading below pre-pandemic highs. We would caution that, in the near term, the rotation has been fast and furious in the small cap space and they may need a bit of a pause before resuming their uptrend. That said, our recovery basket, which includes small caps, remains well positioned to benefit in 2021.
At Timber Point, we can express our small cap preference through low-cost ETF exposure, style specific indexes as well as specific small cap names. Below are two ideas that are off the beaten path that we find interesting.
Fat Brands (FAT) – FAT is a restaurant franchise company that strategically acquires, develops, and markets fast casual and casual dining restaurant concepts on a global basis. FAT currently owns eight restaurant brands including Fatburger, Buffalo’s Café, Buffalo’s Express, Hurricane Grill & Wings, Elevation Burger, Yalla Mediterranean, Ponderosa and Bonanza steakhouses encompassing 366 stores and 176 franchisees across 28 states in the U.S. and 19 countries.
FAT operates an asset-lite business model (franchise owners are responsible for store level capex) and has built a scalable platform to accommodate both organic and non-organic (acquisition) growth thereby enabling new stores and restaurant concepts to be added with minimal incremental corporate overhead. Over the past two years, FAT has grown its store count by roughly 100 stores and added two new concepts, Elevation Burger and Hurricane Grill and Wings. Consequently, as FAT grows its business it should enjoy expanding profit margins and a growing free cash flow profile. Based on 3Q20 results, many of FAT’s concepts have returned to and even exceeded pre-pandemic store volume levels and we expect this to continue into 2021.
Recently, FAT acquired the Johnny Rockets hamburger chain, which effectively doubled its store count and proforma Ebitda. The acquisition and refinancing of a prior loan facility leave FAT with a solid balance sheet as debt metrics were slightly improved by the acquisition. We believe there are further cost synergies to be gained from Johnny Rockets which should drive EBITDA in 2021, post pandemic, into the $15+mln range. If FAT can return to a low teens EBITDA multiple that it traded at in 2019, we believe the the stock could trade into the low teens over time.
Tattooed Chef (TTCF) – TTCF is a newly public company formed by the business combination between special purpose acquisition firm, Forum Merger II Corporation, and Ittella International, a plant-based food company which offers both private label products and Tattooed Chef branded products. The company began operations a decade ago by selling private label products to Whole Foods and Trader Joes before pivoting in 2017 to focus on increasing distribution of its Tattooed Chef brand. The most recent quarter was an inflection point for TTCF as its branded product sales surpassed private label sales for the first time in its history. TTCF is selling into a $55 billion US market for frozen plant-based foods that is growing in the 20% – 30% range per annum. With annualized revenues approaching $200 million and year over year growth of 65% in 3Q20, TTCF is well positioned to gain share.
TTCF has invested heavily in marketing during the past few years and is now ramping up to launch a national marketing campaign to drive further brand awareness. Distribution in increasing as TTCF branded products are now available in ~ 50% of Walmart locations in the U.S. and they have recently inked a strategic partnership with Target. A new distribution partnership with KeHe Distributors will give TTCF access to more than 30,000 locations across the U.S and they are in the process of rolling out a direct-to-consumer option for wanting direct delivery to home. Total SKU’s now total 100 and branded SKU’s have tripled over the past year to 15.
Revenue growth has been exceptional, as noted above, and TTCF has a strong balance sheet to support future growth initiatives after receiving $111 million in cash from the business combination. Gross profit grew in line with revenues the past quarter and the company reported positive adjusted ebitda for the prior 9-month period ended September. We expect growth initiatives to take priority over profits as TTCF has a big opportunity to continue to gain share within the plant-based food market over the coming years. Currently trading at a significant discount to Beyond Meat (BYND) on 2021 EV/Revenue numbers, we believe that continued execution by TTCF could result in significant price appreciation over the next few years.
IMPORTANT DISCLOSURES
The information in this report was prepared by Timber Point Capital Management, LLC. Opinions represent TPCM’s and IPI’s opinion as of the date of this report and are for general information purposes only and are not intended to predict or guarantee the future performance of any individual security, market sector or the markets generally. IPI does not undertake to advise you of any change in its opinions or the information contained in this report. The information contained herein constitutes general information and is not directed to, designed for, or individually tailored to, any particular investor or potential investor.
This report is not intended to be a client-specific suitability analysis or recommendation, an offer to participate in any investment, or a recommendation to buy, hold or sell securities. Do not use this report as the sole basis for investment decisions. Do not select an asset class or investment product based on performance alone. Consider all relevant information, including your existing portfolio, investment objectives, risk tolerance, liquidity needs and investment time horizon.
This communication is provided for informational purposes only and is not an offer, recommendation, or solicitation to buy or sell any security or other investment. This communication does not constitute, nor should it be regarded as, investment research or a research report, a securities or investment recommendation, nor does it provide information reasonably sufficient upon which to base an investment decision. Additional analysis of your or your client’s specific parameters would be required to make an investment decision. This communication is not based on the investment objectives, strategies, goals, financial circumstances, needs or risk tolerance of any client or portfolio and is not presented as suitable to any other particular client or portfolio. Securities and investment advice offered through Investment Planners, Inc. (Member FINRA/SIPC) and IPI Wealth Management, Inc., 226 W. Eldorado Street, Decatur, IL 62522. 217-425-6340.


Recent Comments