Okay, we all need to take a very deep breath. No doubt you have heard the news that Covid-19 cases have increased over the past week, both domestically and internationally. Given what we have been through over the past 6 months this instinctively brings unpleasant memories of economic “lockdowns” and stay at home orders. Let’s look beneath the surface of these numbers to help you understand why we do not think that will be the case this time around.
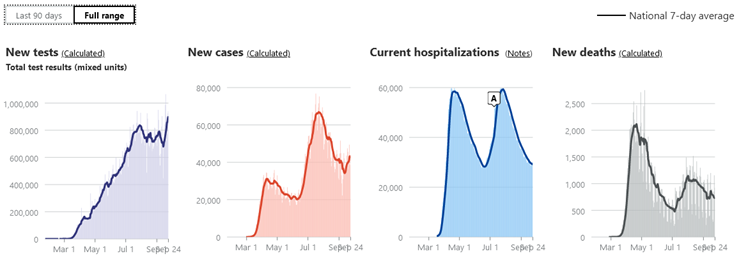
National metrics, provided by the Covid Tracking Project, do show a rise in both new tests and cases (chart below). However, as laid out in our prior blog, we contend that hospitalizations and deaths are the key metrics to watch as public officials will take action based on utilization of healthcare resources and increasing levels of public anxiety/fear associated with rising death figures. Fortunately, the news is encouraging on this front with national hospitalizations having retraced to late June lows and deaths continuing to trend lower, albeit not yet to late June lows.
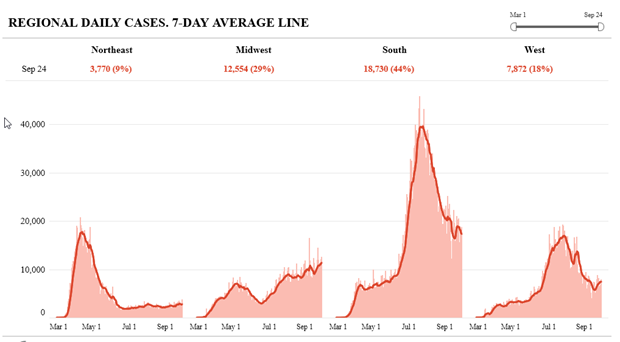
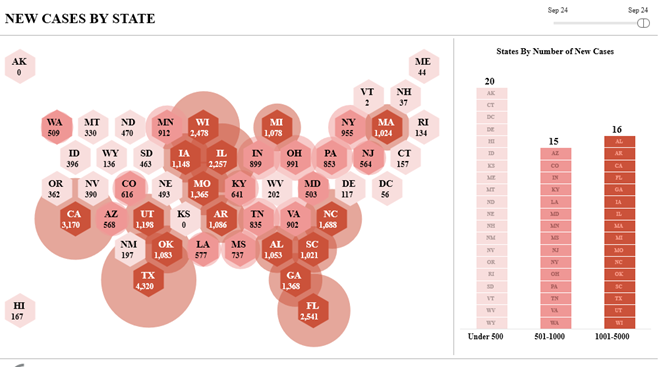
Which begs the question of where are the new positive cases coming from? When we view the data from a regional lens it is clear that the Midwest is the culprit while the South and West regions, which saw cases increase through June and July, continue to experience declines. The Northeast remains subdued.
Despite the rise in Midwest cases, hospitalizations and deaths have only recently seen a slight uptick and are nowhere near prior peak levels. Other regions continue to experience downturns in both metrics.
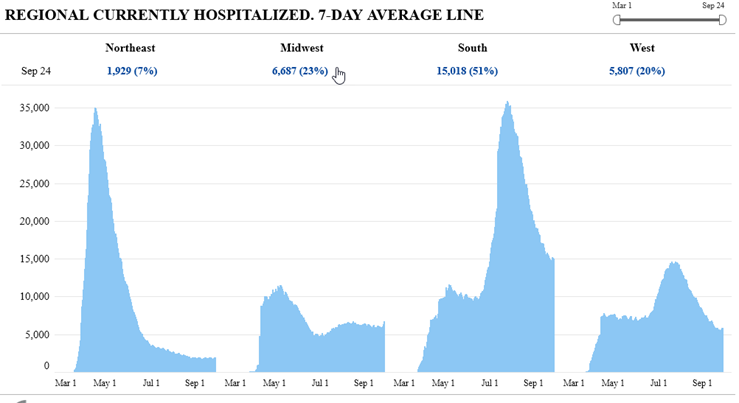
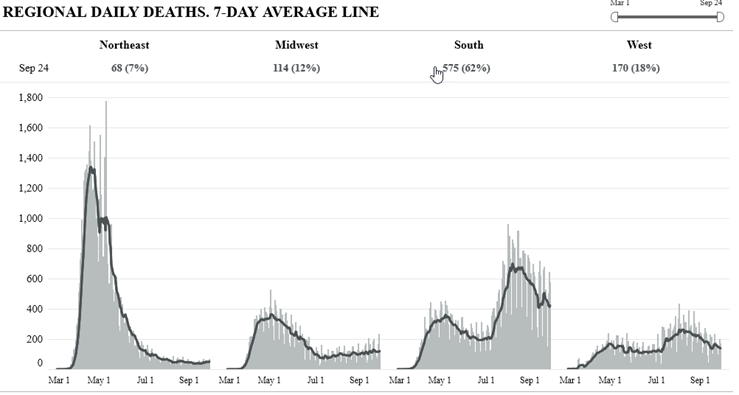
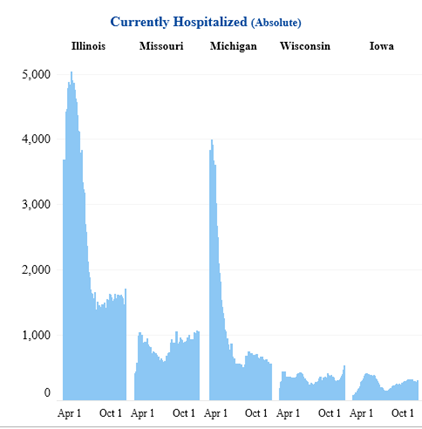
Looking at the state level allows us to hone in on the Midwest states. There are currently five states – Illinois, Iowa, Missouri, Michigan and Wisconsin that now have daily case totals over 1,000. Yet, looking at the hospitalization levels for those five states does not indicate undue pressure being put on the hospital systems. Certainly there is an uptick in Illinois, Missouri and Wisconsin hospitalizations but it is minor. We visited the state websites for each of these five states and found that all five had stable to declining death trends except Missouri which appears to have some “catch up” deaths in the figure – we will continue to monitor this.
Looking further into the age groups responsible for the increase in positive cases is best illustrated by data from Wisconsin (below chart) which shows a dramatic increase in weekly case numbers among the 18-24 age cohort. This increase started in late August and has continued into September. Hmmm…the timing seems quite coincidental to the opening of schools. Finding other time series data on cases by age group is not easy but we did find data on South Carolina’s website which showed the 11-30 age cohort has gone from 20% of cases in May to 40% in September.
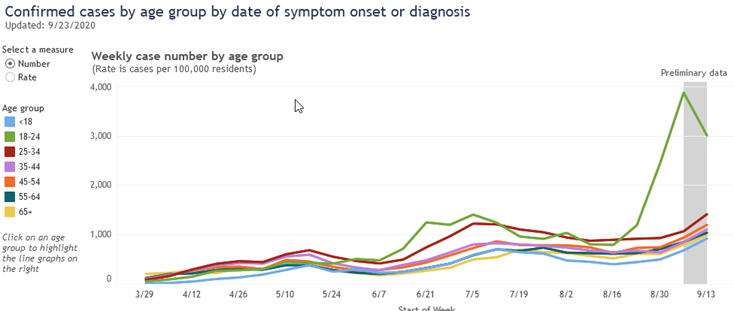
State of Wisconsin Dept. of Public Health
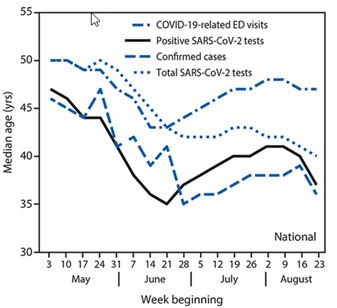
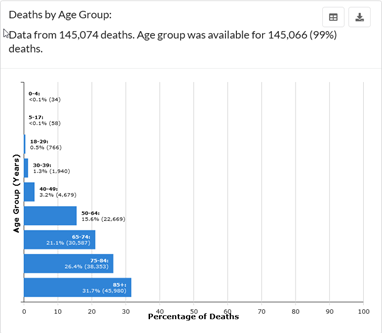
Finally, the CDC has written about the changing age distribution of the Covid-19 pandemic in a report released September 23rd. As seen in the chart below left, the two lower lines are positive tests and confirmed cases, both of which are trending lower in median age since early/mid-August. However, the top line is Covid-19 related ED visits which has seen median age stable during that time frame indicating that positive tests among the younger cohorts are not resulting in hospitalizations. The other chart, below right, is also from CDC and shows that the 18-29 age represents only .5% of total deaths from Covid-19.
In no way do we mean to discount the impact that Covid-19 has had on the economy as well as individuals and families. However, we do need to look behind the top line numbers we hear every day to understand what is going on. The Midwest is now experiencing an increase in cases just like the Northeast, South and West regions have gone through and this appears to be centered on the younger age cohorts that are heading back to school. We need to monitor this, be vigilant with CDC prescribed action and keep the elderly out of harm’s way. However, based on hospitalizations and death rates seen from the younger age cohort, we do not need economic shutdowns or stay at home orders nor should the public put up with this again. We are encouraged to see Florida has removed Covid-19 restrictions and hope other states will soon follow their lead.
As it pertains to the stock market, there are certainly several cross currents that have driven the market down almost 10% from its recent peak. The Cares Act III stimulus discussions, Supreme Court nominations and, of course, November 3rd approaching have likely all played a part in the decline. The recent resurgence of the “work from home” stocks suggests that investors believe the recent increase in Covid-19 cases could push us into extreme measures. We would argue the other side – the U.S. is successfully adapting to the Covid-19 virus. Look at the recent decisions by the Big-10 and Pac-12 to resume football schedules, fashions shows that are back on in Paris and Milan and the French Open allowing fans in the stands. Individual behavior, treatment protocols, therapeutics, potential vaccines and the numbers above all suggest that we are in a far different place today vs. last March or April. We continue to believe that “recovery” stocks will work, our basket has beaten the SPX 500 over the past 3 months since we initiated the trade, and we believe there is more to come. Below we have included a few names that we still find interesting.
Boeing (BA) continues to suffer from the Covid-19 impact on its customer base but also from management missteps that resulted in the grounding of the 737 MAX. The pace of recovery in air travel remains quite uncertain and the stock has performed accordingly as customers cancel or defer orders and attempt to get their own financial house in order. That said, could the worst be over for BA? No one can be certain but one can point to the fact that recertification flights are complete for the MAX, order cancellations are slowing month over month, BA still does have a five plus year backlog to execute against and commercial air travel likely will, at some point, return to being a long-term secular grower. We do not know where the delivery inflection is in BA’s future, but there will be one at some point. Management believes this to be the case as it has stated that it expects operations to be free cash flow positive in both 2H20 and 2021 and, if that proves overly optimistic, they have recently issued debt and stockpiled more than $30 billion in cash for staying power. If/when deliveries ramp, excess cash costs will be reduced and a stock with zero expectations that many have sought to avoid could have its day in the sun again. BA stock traded at $350 pre-pandemic and $230 in June. At its current $150 price it is worth buckling up for what could be an exciting ride.
Constellation Brands (STZ) has a portfolio of import beers, including the familiar Corona and Modelo brands, that play directly into the high end/premium segment of the market which has been the lone growth driver for the industry over the past several years. The appeal of these brands has resulted in increased penetration into the US driving high single digit revenue growth and industry-high beer operating margins. While “on premise” sales (restaurants, arenas, etc) have been hit dramatically as venues shuttered owing to Covid-19 this segment only represents 15% of sales. “Off-premise” activity has surged by almost 20% helping buffer total volume declines to 6%. With 8 of the top 15 selling imported beer brands, we believe STZ is well positioned to continue to gain beer share. STZ has recently entered the hard seltzer market which is expected to see volumes triple in 2020 and should enjoy high growth rates for the next five years as consumers tastes shift to lower calorie and healthier alternatives. Corona Seltzer should benefit from the Corona brand halo affect and carve out top three share in the market after White Claw and Truly and prove to be nicely accretive to STZ’s overall beer franchise. Management is focused on optimizing its portfolio by selling low growth/low margin assets with proceeds earmarked for debt paydown. While some inventory issues exist given the two-month production shutdown in Mexico we believe this is a short-term issue. STZ has recently retraced some of its gains and is now trading at an ~ 15% discount to its 3-year historical EV/Ebitda multiple on C21 estimates. It is unlikely that this stock will ever be cheap given its best in class status, but we believe it has a good chance to move past its $210 pre-pandemic high as it continues to execute.
Live Nation Entertainment (LYV) is the global leader in the $22 billion live event promotion business which has been a secular grower over time as demographics of all ages increasingly prioritize experiences over possessions. However, Covid-19 has resulted in the cancellation or deferral of the vast majority of LYV’s events in 2020 which were estimated to be up as much as 30% over 2019 levels. In response, management has taken steps to right-size the business by cutting $800 million of operating costs to reduce the monthly burn and has raised $1.2 billion of debt capital to fortify the balance sheet. With a cash balance in excess of $3 billion relative to a gross monthly burn of $185 million the company has runway to resumption of normal operations. Management believes that demand has been pushed into 2021 as only 14% of concert ticket holders requested a refund for deferred events and bookings for 2021 are now running ahead of 2020 levels, Thus, LYV management is planning to offer a full summer 2021 slate across its global venues which means several thousand of concerts per quarter for tens of millions of fans and have thus far sold 19 million tickets to more than 4,000 concerts and festivals. While results may not be pretty here for a few quarters there should be increasing transparency on a rebound in event activity that should give investors comfort that event goers will not be locked inside for another year. At its current $51 share price, LYV is 1/3 off its pre-pandemic high and we believe it can at least retrace to that level over the next twelve months.
Pioneer Natural Resources (PXD) is an E&P operator in the Midland basin whose early mover advantage resulted in a low-cost contiguous acreage position that supports industry leading capital efficiency when moving reserves to production. The market has forced PXD (and other E&P operators) to shift its model from growth at all costs as investors refused to continue to finance profitless prosperity. Rather, on its 2Q20 call, PXD gave an overview of its current economic model: reinvest 70-80% of cash flow, grow production by 5% while generating $600 million of free cash flow. PXD will also institute a variable dividend in 2022 that provides for shareholder return beyond its base dividend ($2.20/share) when times are good. PXD’s advantaged acreage position and efficient production, augmented by ongoing cost saving initiatives, drives best in class capital efficiency. As with other E&P’s, PXD will need to navigate through weak near demand trends that have resulted in oil inventories well beyond normal. Balance in the oil market is precarious as last March OPEC and Russia decided to turn on spigots in a market share spat just as Covid-19 was crushing oil demand. They quickly retreated from that stance and we believe production discipline will be the norm going forward. PXD’s balance sheet is very conservatively levered at .6x net debt/ebitda and we expect upside to current flat 2021 production guidance as management is in under promise and over deliver mode. We see ~ 30% return upside to our $115 price target which is still below its pre-pandemic high of $150 and assumes that PXD maintains a premium multiple to its peers based on its best in class operating and financial profile.
Visa (V) remains the top dog in the card network market with ~ 60% of worldwide gross payment volumes which have driven double digit revenue growth and strong operating margins over the prior twelve years of its public life. It should remain a direct beneficiary of the continued digitization of payments at the expense of cash and check usage globally and its scale should provide it with strong barriers to entry and the wherewithal to pursue new large new markets like the B2B payment market, estimated to be a $120 trillion TAM with 70% of volumes still paper based. Recent results show that transactions and payments volume continue to improve from April trough levels, however cross border volumes remain sluggish and will require a reopening of borders and return to international travel. Two positive metrics to monitor, growth in cross border e-commerce, ex travel, has seen monthly increases in the high teens since mid-April and Card Not Present transactions have accelerated by more than 20% each week since mid-April, which is twice the pre Covid growth rate. We see V as a consolidator of emerging technologies as evidenced by their recent acquisition of Plaid, their largest to date. There is little not to like about the V business model – consistent revenue growth, outstanding margins, minimal capex that drives substantial FCF resulting in a rock-solid balance sheet with nearly net cash position and rising returns to shareholders. With the recent pullback, we believe V is attractive given the secular trends driving TAM expansion that should support a low 30’s multiple on 2022 normalized eps resulting in a $235 share price target.
IMPORTANT DISCLOSURES
The information in this report was prepared by Timber Point Capital Management, LLC. Opinions represent TPCM’s and IPI’s opinion as of the date of this report and are for general information purposes only and are not intended to predict or guarantee the future performance of any individual security, market sector or the markets generally. IPI does not undertake to advise you of any change in its opinions or the information contained in this report. The information contained herein constitutes general information and is not directed to, designed for, or individually tailored to, any particular investor or potential investor.
This report is not intended to be a client-specific suitability analysis or recommendation, an offer to participate in any investment, or a recommendation to buy, hold or sell securities. Do not use this report as the sole basis for investment decisions. Do not select an asset class or investment product based on performance alone. Consider all relevant information, including your existing portfolio, investment objectives, risk tolerance, liquidity needs and investment time horizon.
This communication is provided for informational purposes only and is not an offer, recommendation, or solicitation to buy or sell any security or other investment. This communication does not constitute, nor should it be regarded as, investment research or a research report, a securities or investment recommendation, nor does it provide information reasonably sufficient upon which to base an investment decision. Additional analysis of your or your client’s specific parameters would be required to make an investment decision. This communication is not based on the investment objectives, strategies, goals, financial circumstances, needs or risk tolerance of any client or portfolio and is not presented as suitable to any other particular client or portfolio. Securities and investment advice offered through Investment Planners, Inc. (Member FINRA/SIPC) and IPI Wealth Management, Inc., 226 W. Eldorado Street, Decatur, IL 62522. 217-425-6340.



Recent Comments