The Timber Log is a quick overview of Timber Point Capital’s most recent investment thoughts. If you have questions about the content, please reach out to Patrick Mullin. The information contained herein does not constitute investment advice or a recommendation for you to purchase or sell any specific security.

What is the Fed focused on as we head into 2023?
- Not backing off desire for “sustained” reduction in inflation to 2% target…no hint of pivot
- Powell and governors will continue to jawbone market to anchor inflation expectations
- Lag effect chatter is interesting…claims that 2022 action “has yet to be felt”…really?
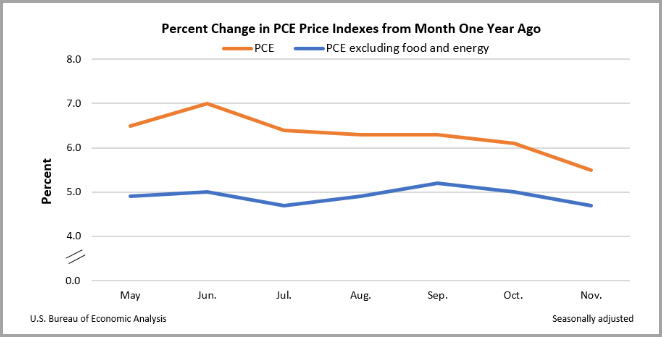
- Acknowledges goods inflation (PCE) receding as supply chains normalize
- Acknowledges that rate hikes (mortgages) have impacted housing related activity
- Yes, OER/shelter remains elevated with rents resetting higher y/y – but expects mid 2023 turn
- AND business fixed investment is in a downturn…margin squeeze, inventory levels amidst slow growth turns companies cautious
- Fed is laser FOCUSED on ~ 55% of PCE that is non-housing related services…wages are biggest worry now
- Average hourly earnings in last payrolls report still elevated at 5%…
- “Out of balance” labor market is key driver forcing the Fed’s hawkish hand/rhetoric
- Labor force participation still down…vs. pre-pandemic ~ 4MM workers shy due to retirements and Covid
- Wow – Powell can see a slight recession to tame wage growth; unemployment rises to 4.6% by end of ’23…??
- Recession hopefully tempered by ongoing mismatch between labor supply and demand
- JOLTS important to watch for number of job vacancies, coming down but still historically strong
- Growth estimates of < 1% are function of maintaining inflation fighting credibility
- Fed dot plot shows rate cutting begins mid ’23…focus on labor market = wages and employment

The 60/40 strategy had a tough year…but performed as constructed…
- Our economist, Victor Canto, takes an in depth look at the utility of the 60/40 strategy over time
- Negative correlation, the traditional argument for the 60/40, is not the prevailing scenario
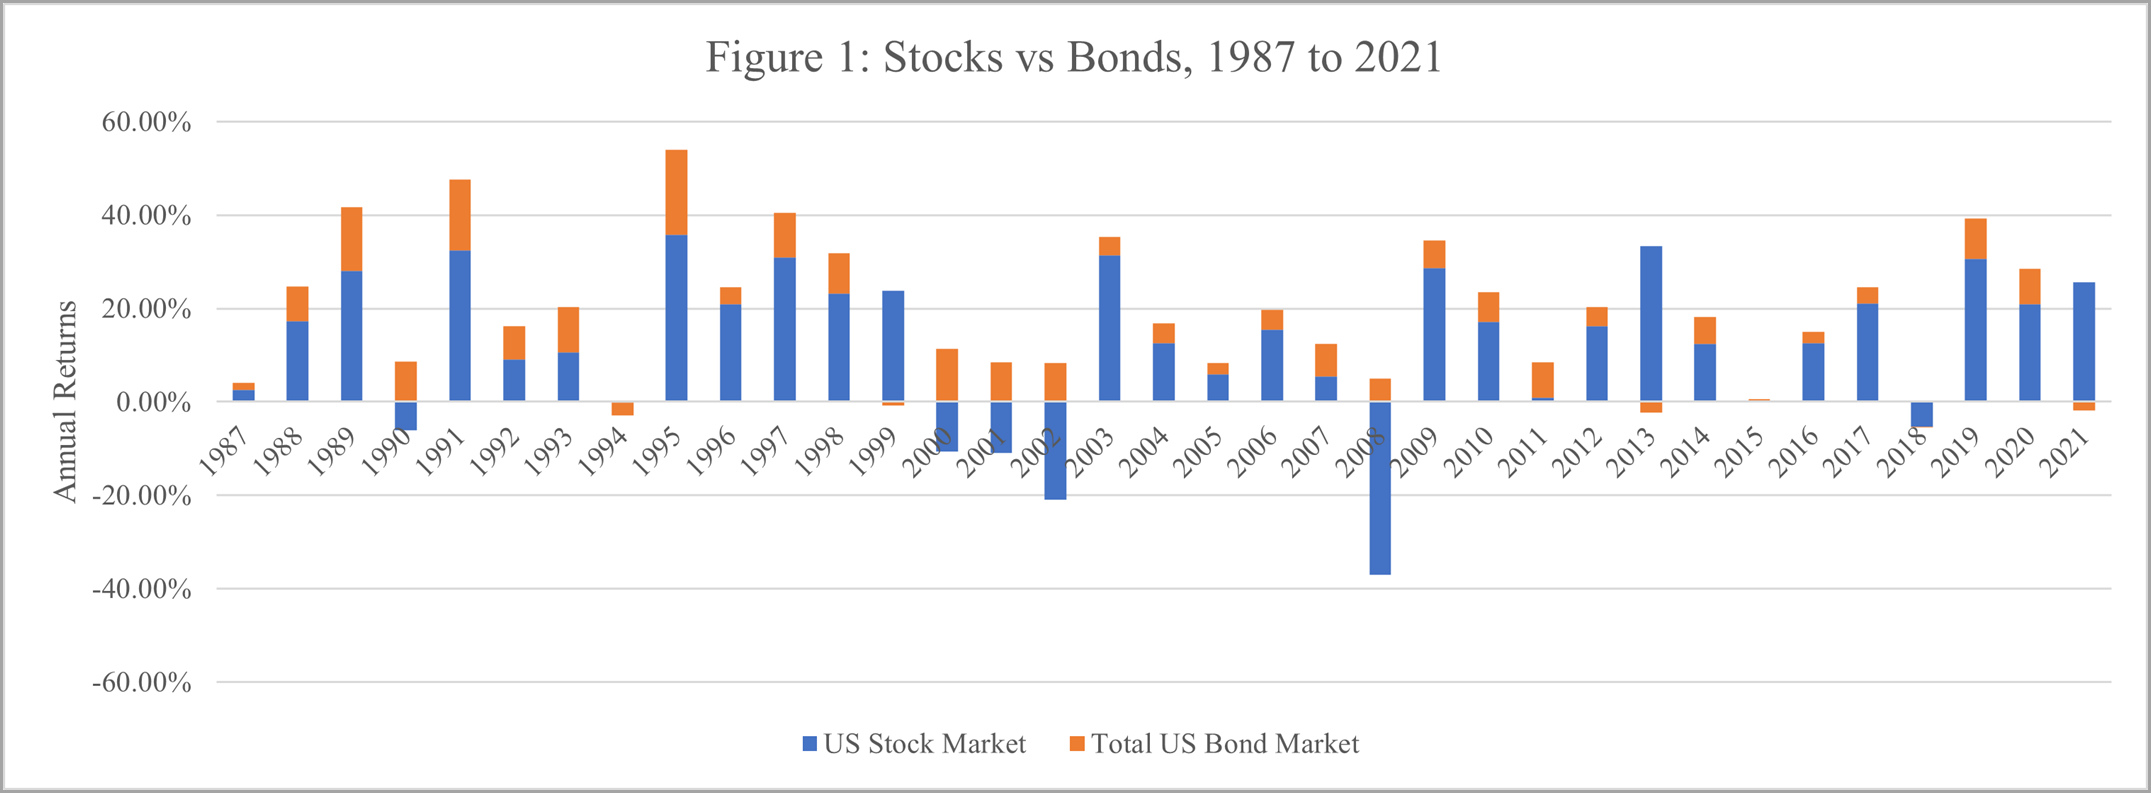
- Only 15% of the time over past 35 years (1987 – 2021) has negative correlation (equity down, bonds up) been the case
- Negative correlation results in outperformance of 60/40 versus a 100% equity portfolio by an average 2200 bp’s per year
- Absent negative correlation, when bonds perform better than equities, 60/40 still outperforms 100% equity
- In this scenario, outperformance is more subdued (110 bps/yr when equity/bonds positive; 160 bps/yr when equity/bonds negative)
- 2022, through October, is in line with expected outperformance of 60/40 vs. 100% equity when both asset class returns are negative
- The 60/40 outperformed 100% equity only 27% of the time, but by an average of 11.7% per year
- Over the remaining years, 100% equity outperformed the 60/40 by 5.7% per annum
- The delta between 60/40 and 100% equity outperformance scenarios provides a proxy for the cost of 60/40 “insurance…~ 87bps per annum
- The question we ask is when is the “cost” of the 60/40 strategy appropriate? The answer depends on your time horizon
- If you can patiently wait out downdrafts, you can benefit by avoiding the ~ 87 bps of “insurance” cost of the 60/40 as the 100% equity portfolio outperforms over extended time periods
- But for shorter horizon investors, in environments where both strategies declined > 10%, the 60/40 experiences fewer and much smaller drawdowns than 100% equity
- When recovery rates from drawdowns are greater than 1 year, in every instance the 60/40 recovery rate exceeds that of 100% equity
- This lends credence to the argument for 60/40 downside protection, especially for investors with more modest investment time horizons
- Victor looked at historical mean returns and standard deviations for both asset classes over time
- Based on 2022 returns (thru October) the magnitude of decline for BOTH stocks and bonds was a black swan event in 2022, 1 in 300 odds
- Placed in historical context, the likelihood of 2022 stock and bond returns appearing in unison in future years is rare and thus the 60/40 remains a reasonable strategy for most investors
ROW Central bankers are playing catch up – investment implications
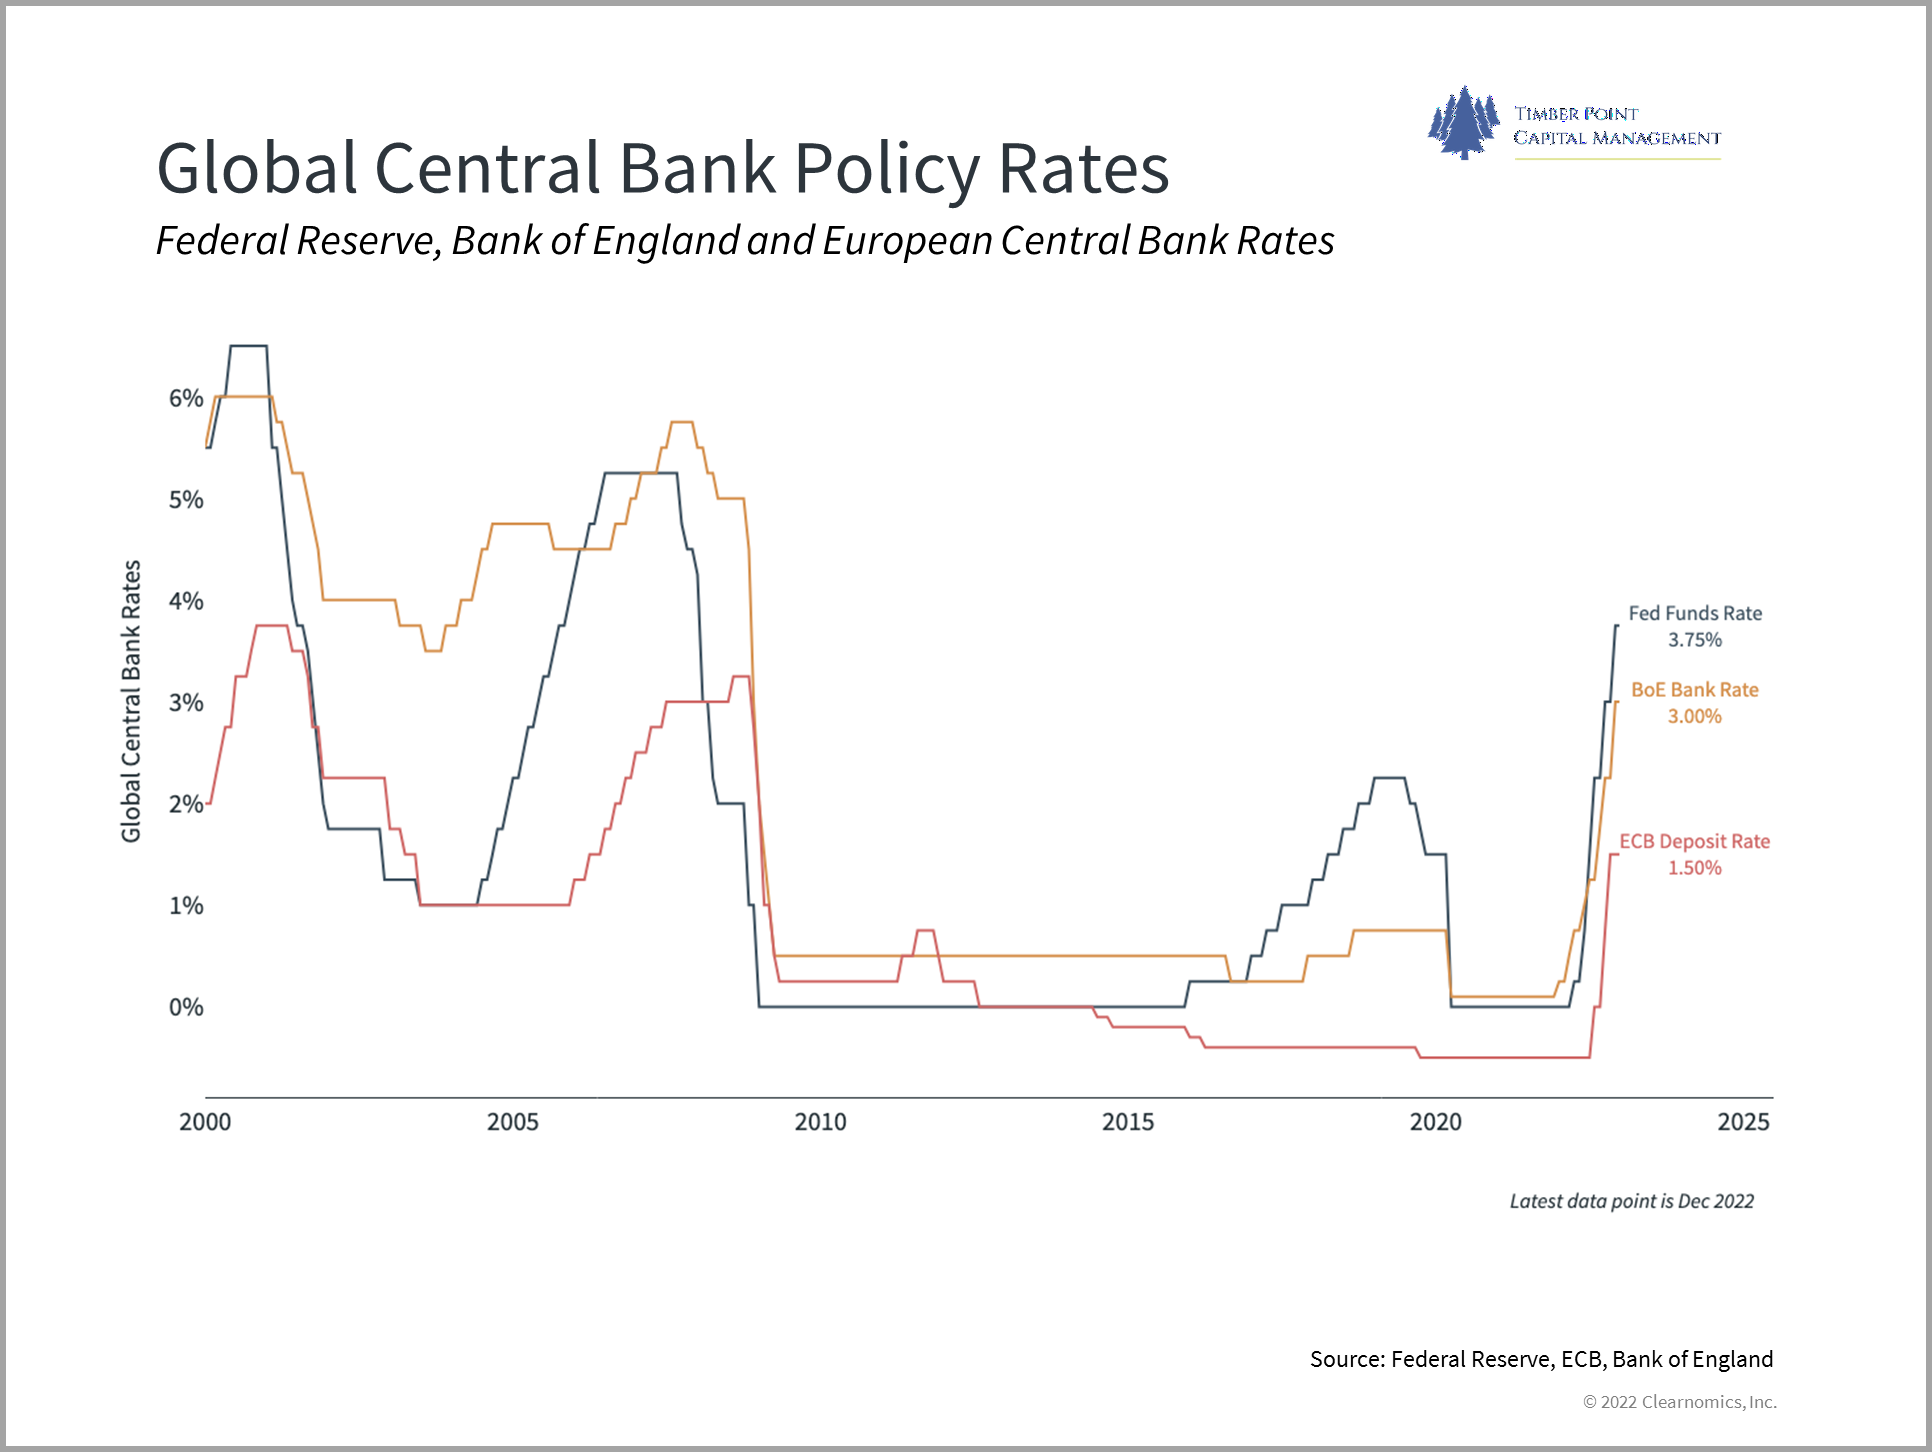
- ECB notes rates will rise “significantly, at a steady pace” to combat worse inflation than in U.S.
- BOJ widens band of yield curve control to 50 bps vs. prior 25 bps…first step in normalization?
- Last holdout of ZIRP (BOJ) is slowly pivoting, 15 years of free money is over
- Powell can jawbone markets but after 425 bps of hikes in 2022, only incremental steps left in U.S.
- Other central banks are taking the baton from the Fed and will be more aggressive in 2023
- U.S. dollar weakness continues – this is tailwind for ROW equity markets, continues in 2023
- U.S. long duration growth stocks were main beneficiaries of free money…no longer
- ARKK continues to underperform Nasdaq decline trajectory from 2000 dot-com bubble burst
- Domestic, market cap weighted (SPX 500), tech focus was best bet during free money era…now reversing
- Value stocks, small cap, risk adjusted yields, international markets, currency plays, perhaps China re-opening plays (commodities?) returning to a degree of investor favor
- Expect to see more muted equity returns, greater dispersion among asset classes, favoring equal weighted exposure
- Is a good environment for stock pickers – countries, sectors, alternatives and individual companies
- Look at ICOW…Int’l ETF targeting highest cash flow yielding companies…6x eps, 5% yield

The death of TINA…but be careful of migration patterns
- There are now alternatives…one of them are municipals which are sporting attractive, tax advantaged yields
- We would be careful about population migration – there are relative winners in state/local geographies
- As many state/local governments were flush with Covid cash, they ramped up spending
- Reality will bite soon, especially with lower capital gains…municipalities could be pinched for revenues
- Refinancing and new debt will cost more, many will try to paper over shortfalls with tax increases
- This will exacerbate the migration patterns already in existence…populations will decline in states where they are not treated well
- Given election coverage and WFH opportunities, people are far more in tune with opportunity sets in tax advantaged states
- Be wary of CA as very dependent on capital gains for revenues, new revenue sources will likely target your wallet
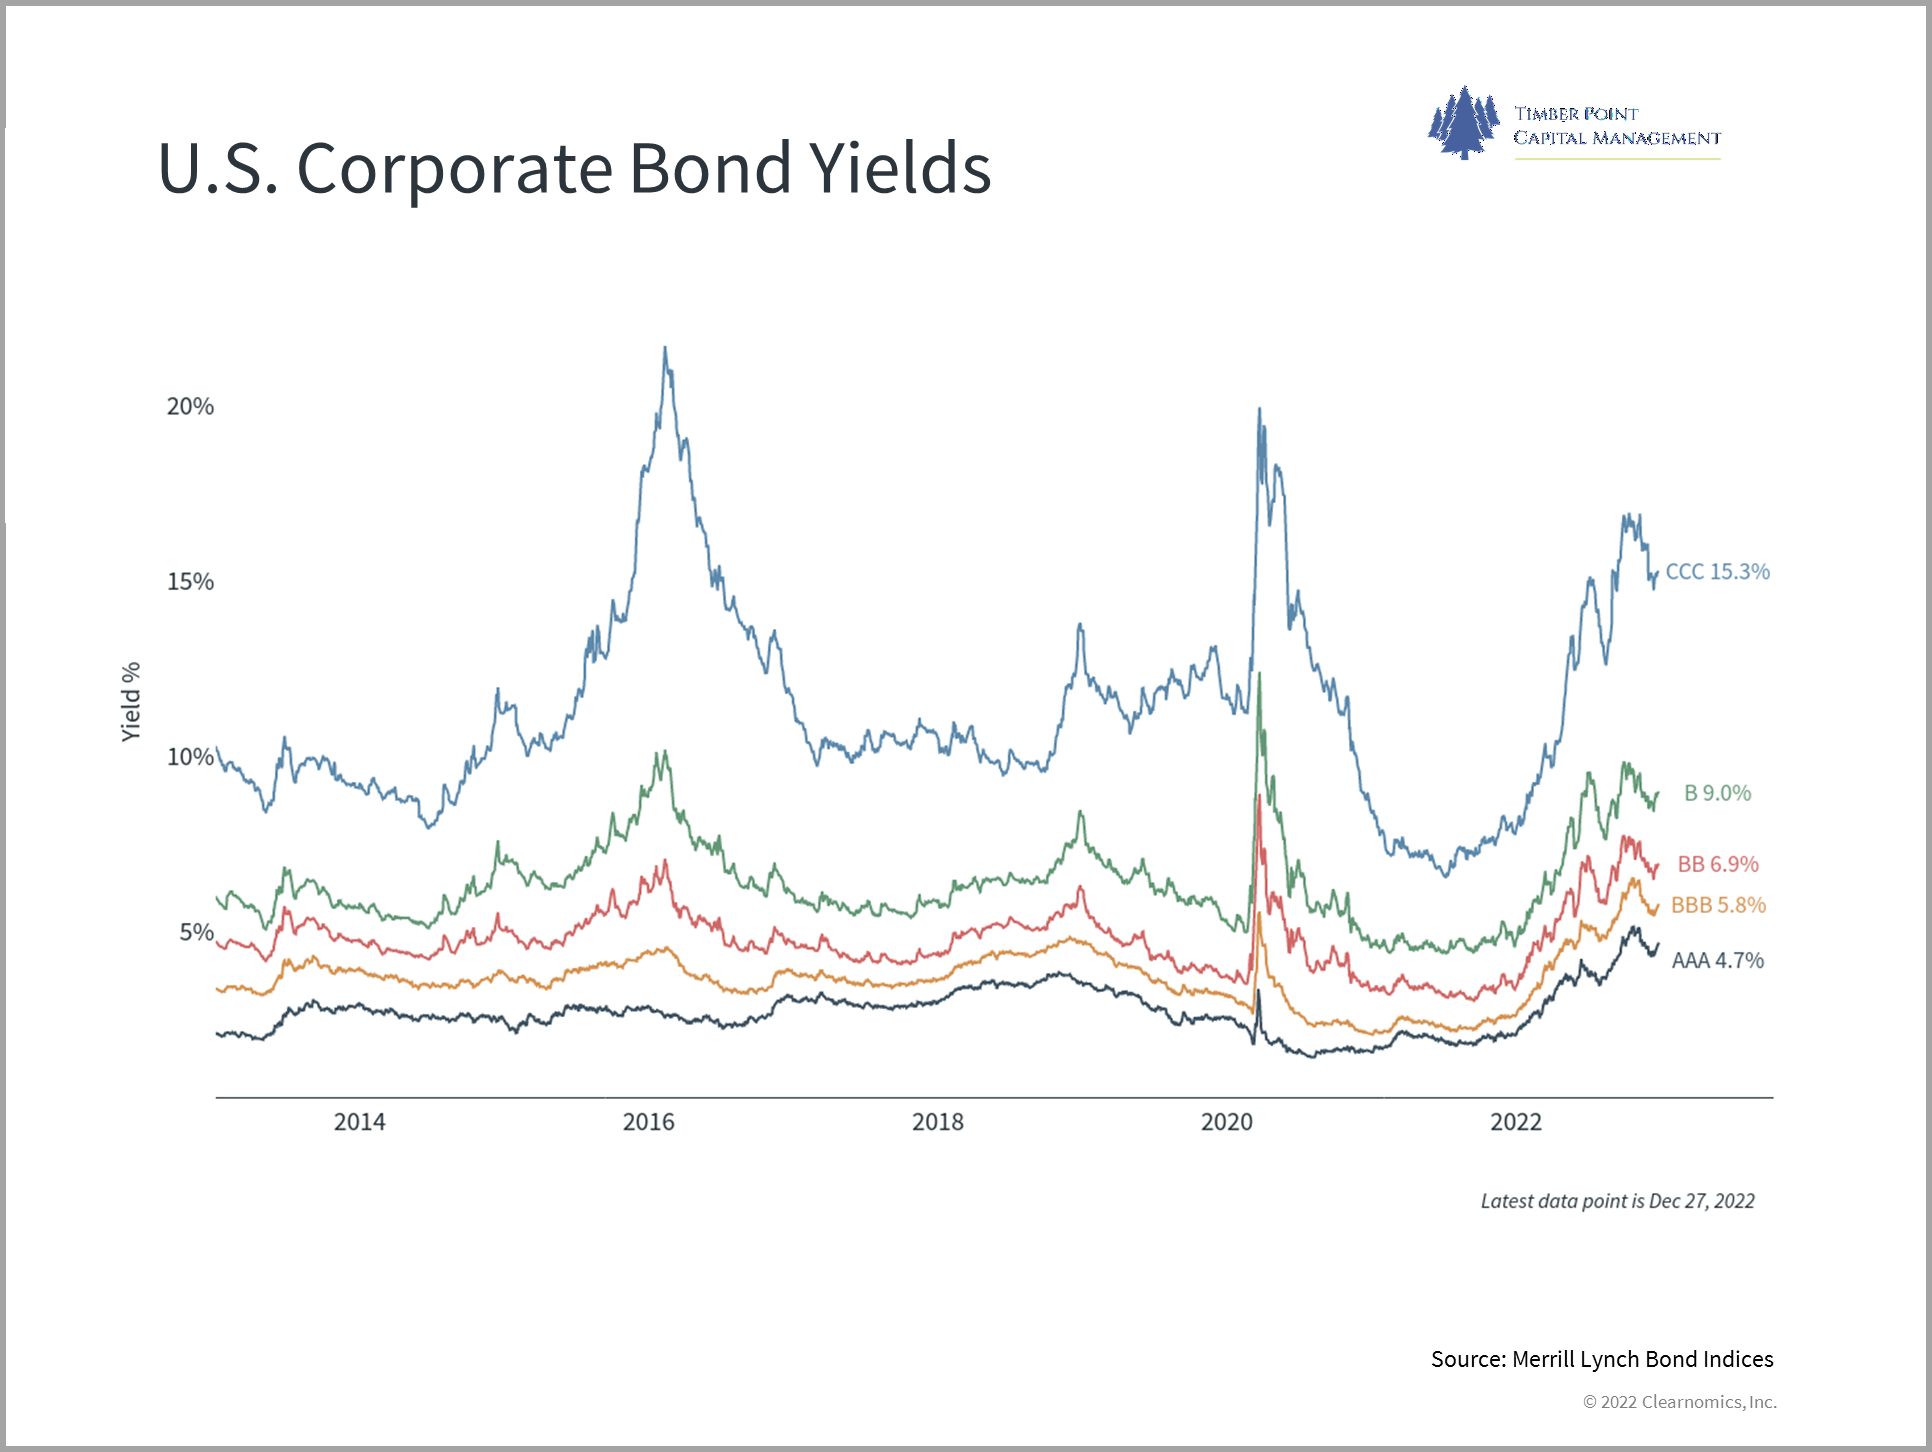
- Looking at AAA municipal bonds vs. govt bonds…more attractive yields in municipals on longer end…be mindful of the credit risk, of course

Recession Watch – state by state economic conditions could provide clarity
- Interesting note out of the St. Louis Federal Reserve on using the Philly Fed SCI (State Coincident Indexes) to determine a threshold number that signals a national recession
- SCI’s are determined by each state’s non-farm payroll employment, average hours worked in manufacturing by production workers, unemployment rate and wage and salary disbursements
- Chart above plots number of states that had negative month/month growth rates based on SCI
- Not surprisingly, national recessions are caused by conditions in individual states…this is a tally of individual states economic performance
- There appears to be an average threshold number of 26 needed to have reasonable confidence that the national economy in fact entered into recession
- This threshold is defined as the number of states that have negative SCI growth during the first month of the national recession
- Interesting that the number of states with negative SCI during 1Q/2Q 2022, both negative growth quarters, did not meet the threshold number for a national recession
- Currently, there are 27 states with negative SCI which would exceed the threshold needed for a national recession
- Populous states like CA, TX and FL are not adjusted for their disproportionately large economies
- We know 2023 economic growth estimates are challenged and earnings estimates are a big consideration for investors as we enter 2023
- The Philly Fed SCI will be an interesting indicator to watch over the next few months
IMPORTANT DISCLOSURES The information in this report was prepared by Timber Point Capital Management, LLC. Opinions represent TPCM’s and IPI’s’ opinion as of the date of this report and are for general information purposes only and are not intended to predict or guarantee the future performance of any individual security, market sector or the markets generally. IPI does not undertake to advise you of any change in its opinions or the information contained in this report. The information contained herein constitutes general information and is not directed to, designed for, or individually tailored to, any particular investor or potential investor. This report is not intended to be a client-specific suitability analysis or recommendation, an offer to participate in any investment, or a recommendation to buy, hold or sell securities. Do not use this report as the sole basis for investment decisions. Do not select an asset class or investment product based on performance alone. Consider all relevant information, including your existing portfolio, investment objectives, risk tolerance, liquidity needs and investment time horizon. This communication is provided for informational purposes only and is not an offer, recommendation, or solicitation to buy or sell any security or other investment. This communication does not constitute, nor should it be regarded as, investment research or a research report, a securities or investment recommendation, nor does it provide information reasonably sufficient upon which to base an investment decision. Additional analysis of your or your client’s specific parameters would be required to make an investment decision. This communication is not based on the investment objectives, strategies, goals, financial circumstances, needs or risk tolerance of any client or portfolio and is not presented as suitable to any other particular client or portfolio. Securities and investment advice offered through Investment Planners, Inc. (Member FINRA/SIPC) and IPI Wealth Management, Inc., 226 W. Eldorado Street, Decatur, IL 62522. 217-425-6340.


Recent Comments