The Timber Log is a quick overview of Timber Point Capital’s most recent investment thoughts. If you have questions about the content, please reach out to Patrick Mullin. The information contained herein does not constitute investment advice or a recommendation for you to purchase or sell any specific security.
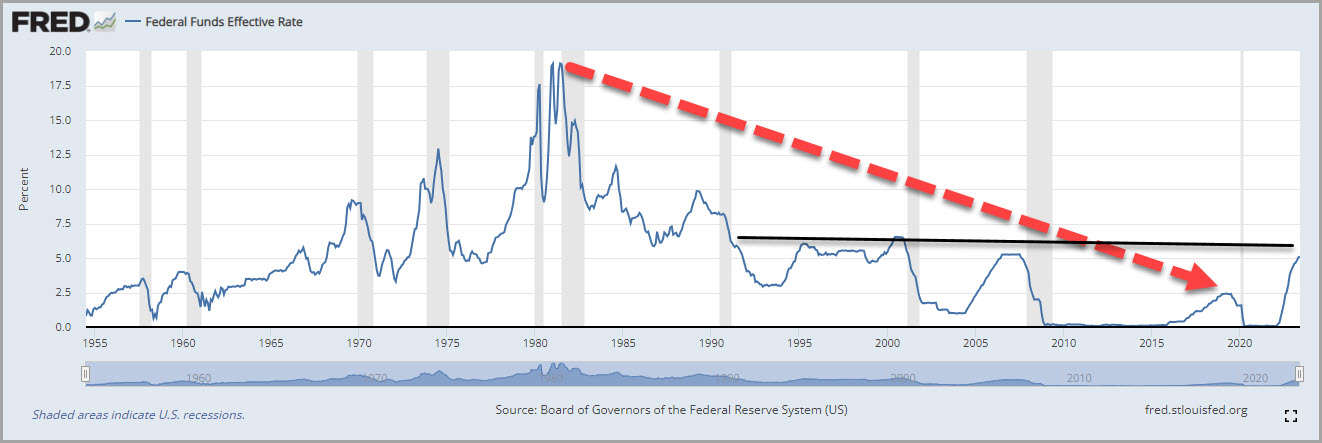
Fed keeps carrying a big stick…doesn’t give an inch on the outlook
- More of the same at the Powell presser on Wednesday…more stern talk about further rate hikes still being on the table…
- Fed funds rates now the highest in 22 years…FOMC searching for “below trend” growth which will be needed to tame inflation
- Don’t expect rate cuts in the next 12 months…and no certainty that the Fed skips an opportunity to raise rates in September, as they did in June
- Powell suggests that the core is the key, June’s report pegs it at 4.8%…will now have multiple inflation reports to digest before meeting again in September…
- The economy remains resilient…service inflation remains the concern as wages continue to grow as a result of still tight employment
- Wage growth is off the recent highs but still elevated when compared to the past 20+ years…have a look at the Atlanta Fed Wage Tracker
- Market expectations for rate cuts have moved meaningfully (80%) to no rate cut in September per CME FedWatch Tool…odds of a cut in January increase to 20% and to 36% in March
- Is the economy that strong? Real GDP grew 2.4% annualized in the advance reading for 2Q23…notable was a deceleration in personal consumption expenditures – something to watch
- Manufacturing data is weak with little sign of a rebound…the Manufacturing ISM report showed an 8th straight month contraction
- The consumer may be slowing but is still strong…our take is that Powell doesn’t want to take his foot off the rate hike accelerator for fear of losing the hard fought gains of inflation progress thus far…
- Household Net Worth has plateaued…as has Personal Savings post the Covid acceleration…until unemployment begins to falter the consumer will fuel further expansion
- Initial Unemployment claims continue to flatline, as recent fears of an acceleration have ebbed…based on Fed commentary, expect the Fed to be “loud and proud” until they start to see some deterioration in this metric…
- Do we worry about the Fed going too far? Of course…especially with sentiment readings now so positive for a soft landing…and real interest rates at/near twenty year highs…
- Maybe one more rate hike is our thought for the Fed to prove its mettle…the heavy lifting has been completed, hopefully the patient/economy can continue to rest easy
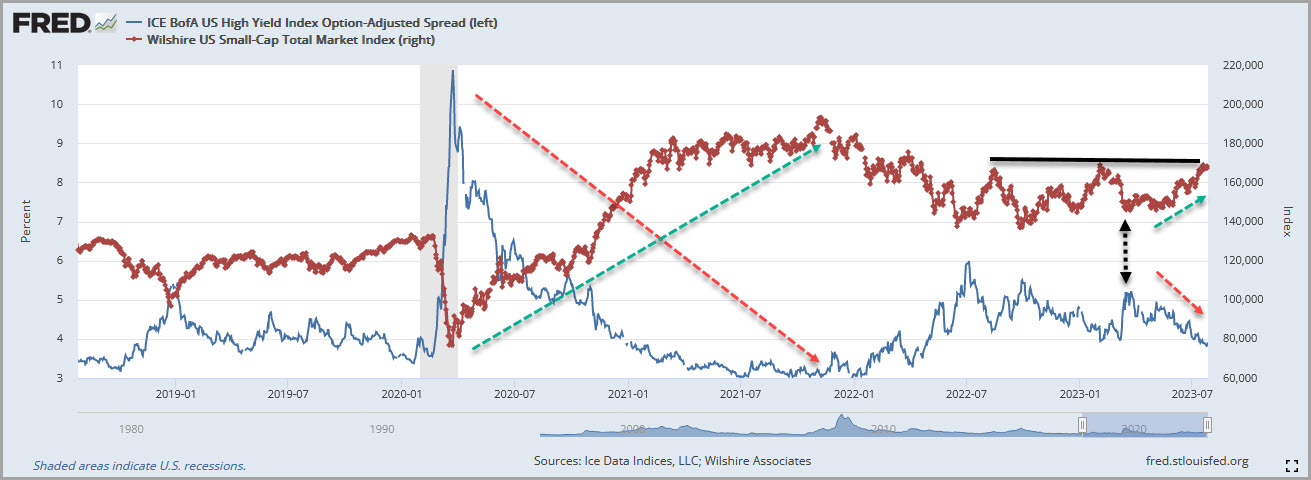
Small Cap trying to break out post MBS (March Banking Stress)
- Recent strong performance for small caps (Wilshire in chart above) has coincided with high yield (HY) spreads declining post MBS
- Small caps (IWM) are now at a level (200) that proved to be resistance in both August ’22 and February ’23 when HY spreads contracted to the low 4% level…
- Now, after touching 5% post MBS, HY spreads have again retraced, this time to below 4%
- This has helped small caps largely match large cap (SPX) performance since then (15% vs. 16% thru 7/26)
- While this may not seem remarkable, remember that since peaking in Nov ’21, small caps have underperformed large caps by 700 bps
- With a persistent consumer supporting a resilient economy, the question becomes where next for HY spreads and thus the small cap market
- Removing Covid and the Financial Crisis from the equation, HY spreads have touched the low to mid 3% level a few times (1997, 2005, 2014 and 2018) over the past 20+ years
- Small caps are now bouncing against resistance levels (IWM 200) that has stopped two recent advances (Aug ’22 and Jan ’23)
- With a resilient economy (GDP still chugging along) and lacking another credit driven event, it is conceivable that HY spreads can continue to decline a bit
- But barring improvement in HY spreads, we can look to valuations of small caps as reason that they could continue to perform
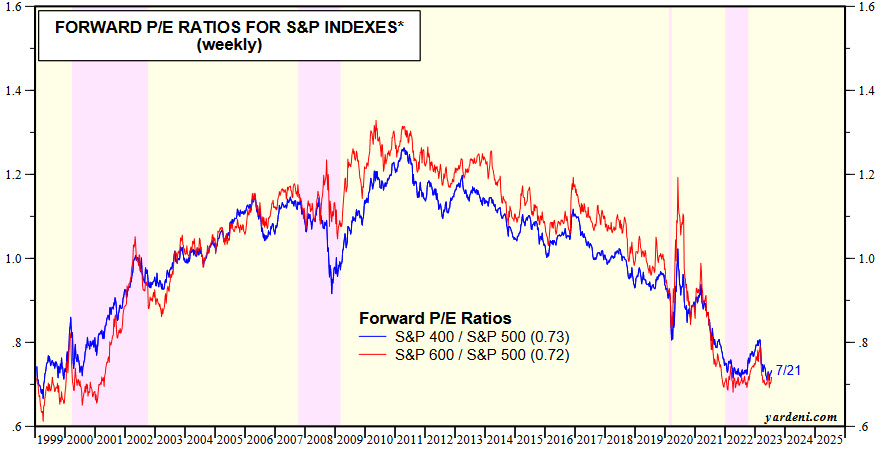
- Thanks to Yardeni Research who has calculated relative forward P/E ratios (figure 19) for the S&P 400 and S&P 600 compared to the SPX 500
- Bottom line, small caps haven’t been this cheap relative to large caps going back to 2000…absolute levels are back to 2011 and 2008 levels…
- Yes, small cap revenues have plateaued while mid and large continue to grow (figure 3)…yes, margins have declined from post Covid highs (figure 7) – but so have mid and large cap margins
- If Powell is right that the economy remains resilient, that should support domestically driven small cap revenue and margins…without an earnings collapse, valuations can normalize…in other words, recession has already been discounted in this asset class
- If Powell needs to act more quickly on interest rate cuts, small caps should have the most leverage of domestic asset classes
- Heads we win, tails you lose scenario? Unlikely that easy…but we like the risk/reward from here
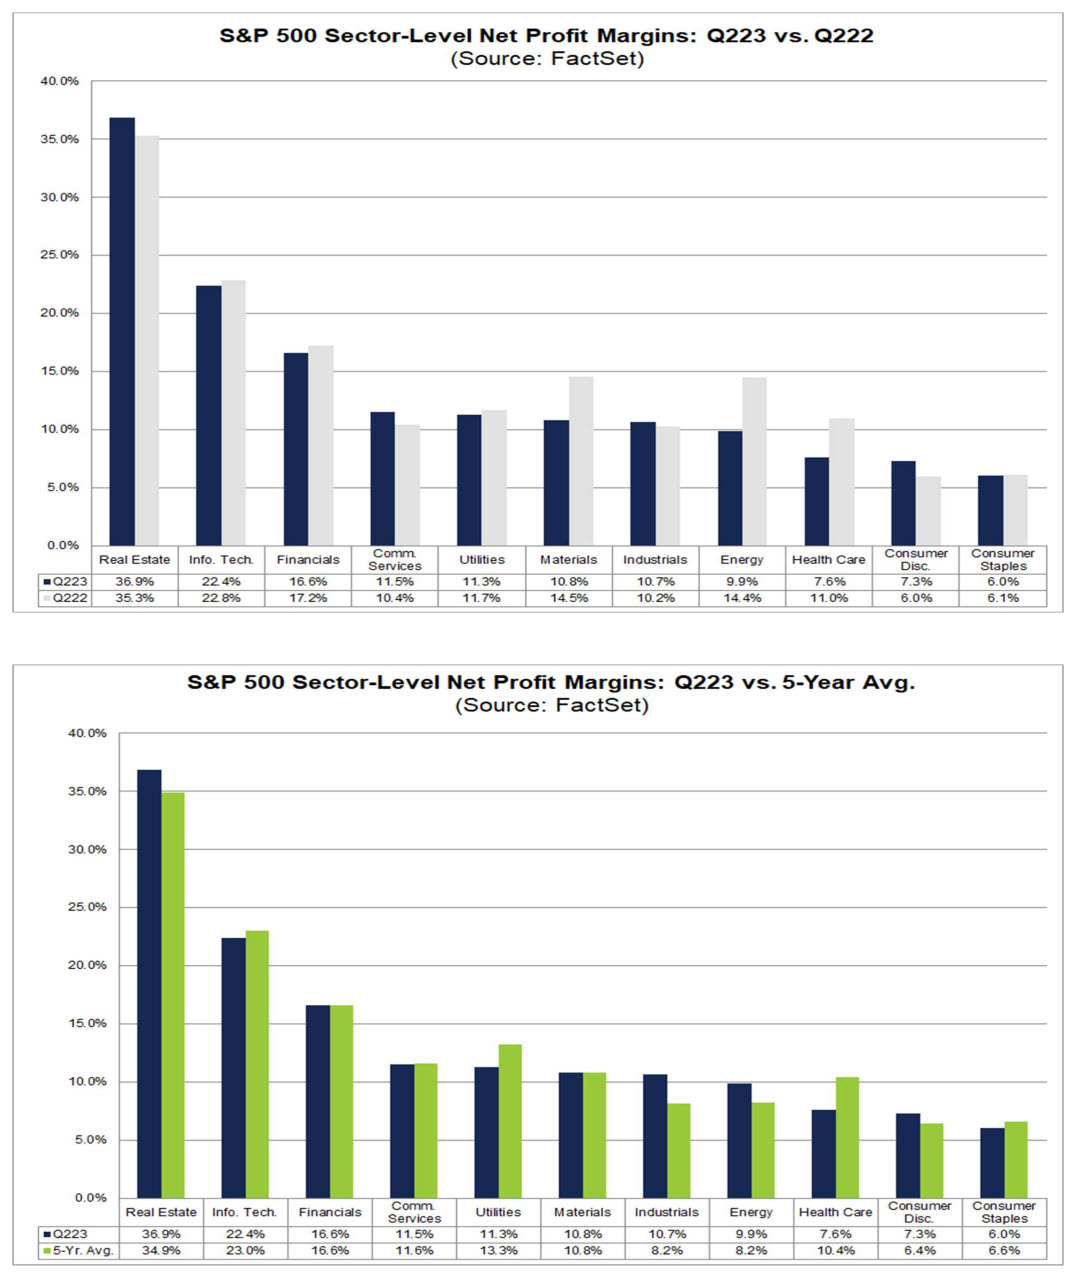
Source: Factset Research
Earnings Update…Margins continue their declining path in 2Q23
- We were struck by the fact that the blended earnings (reported plus estimated) decline for the SPX in 2Q23, per Factset, currently stands at -9%…this will represent the largest Y/Y earnings decline since 2Q20…
- With revenues largely flat, estimated down just .3%, the culprit is margins which continue their downward spiral, now projected to decline on a Y/Y basis for the 6th straight quarter
- Margins peaked in 2Q21 at 13% which represented a 100-200 bp acceleration from pre-Covid levels
- Margins have now returned to pre-Covid levels (11%)…that shouldn’t be all that surprising given the quick rise from 2020 trough levels (2Q20 8.5%)
- Supply chains have largely been normalized yet even small inflationary pressures amidst a difficult revenue environment can result in declining margins…we know that wage growth has come off the boil but still remains elevated relative to history (Atlanta Fed Wage Tracker)
- Overall, 6 of 11 sectors are expected to post declining margins…chief among them are the materials and energy sectors which may have seen elevated costs but also revenue declines greater than average owing to a weaker commodity price environment
- Surprisingly, technology is expected to see declining margins, albeit modestly, and is also expected to be below its 5 year average…
- A t 22.5%, margins in technology are still double or more other industries ex financials…as capacity right sizes in the industry and Covid demand ebbs, it may prove difficult to maintain such levels
- On the plus side, consumer discretionary margins are expected to increase by the greatest amount, no doubt benefitting from a lack of markdowns that plagued their profitability in 2022
- We were surprised to see Industrials still growing margins…we would have thought the demand environment as suggested by many macro indicators would have been a headwind
- It will be interesting to see where net margins shake out going forward…if revenue growth continues to be challenged, companies will need to cut costs to stabilize margins and hence eps
- With 2024 SPX earnings expected to grow a bit more than 12% in 2024 (from $217 to $245), stabilization and improvement of margins will be critical to hitting the estimate
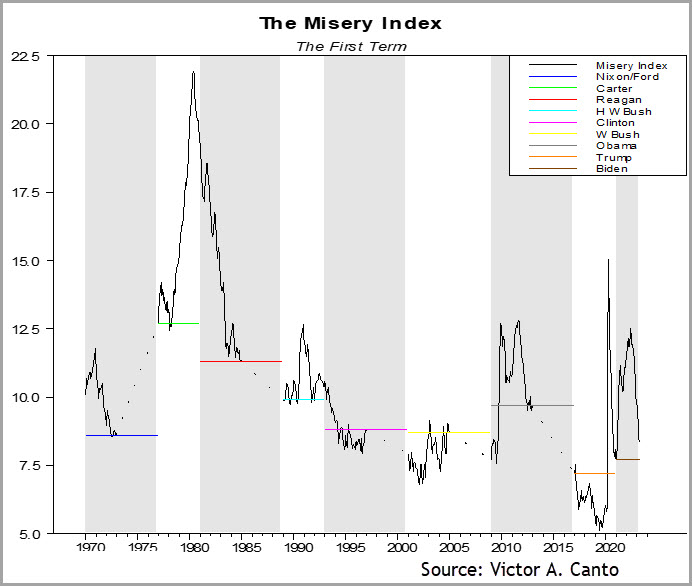
Bidenomics is just Build Back Better rebranded…Re-election hopes rest on inflation and unemployment figures
- Victor has an article out on Biden’s re-election prospects based on improvements in the in inflation and unemployment figures…click here to read
- Imitation is the sincerest form of flattery but in this case only the marketing of the “Bidenomics” message is similar to Reagan…not the policies
- Bidenomics offers industrial policy, increased government spending as well as higher regulations and taxes – all opposites of Reagan’s plan
- Data show a strong correlation between the “misery index”, the combination of inflation and unemployment, and President re-election prospects
- Policies matter…as the misery index declines below inauguration levels, re-election likelihood increases…Biden has yet to improve the misery index
- Bush II and Obama were able to overcome a high misery index owing to significant events: the 9-11 terrorist attack and the Financial Crisis
- How likely is it that Biden can chart a path to a lower misery index? The Fed will be the driver of the inflation rate via monetary policy…
- If inflation is too much money chasing too few goods, to reduce inflation the Fed needs to reduce the quantity of money circulating in the economy
- We expect the Fed to be successful in gradually reducing its balance sheet although the pace of reduction will decline over time
- We believe that Bidenomics is simply Keynesian aggregate demand management…which results in increases in output and employment
- However, Republicans should be able to constrain Bidenomics via the debt negotiation and forthcoming budget negotiations…given the unemployment rate is at historical lows, we expect that it will deteriorate from here
- Our analysis is that inflation reduction will be modest and unemployment will deteriorate…these are not encouraging developments for Biden’s re-election prospects
IMPORTANT DISCLOSURES The information in this report was prepared by Timber Point Capital Management, LLC. Opinions represent TPCM’s and IPI’s’ opinion as of the date of this report and are for general information purposes only and are not intended to predict or guarantee the future performance of any individual security, market sector or the markets generally. IPI does not undertake to advise you of any change in its opinions or the information contained in this report. The information contained herein constitutes general information and is not directed to, designed for, or individually tailored to, any particular investor or potential investor. This report is not intended to be a client-specific suitability analysis or recommendation, an offer to participate in any investment, or a recommendation to buy, hold or sell securities. Do not use this report as the sole basis for investment decisions. Do not select an asset class or investment product based on performance alone. Consider all relevant information, including your existing portfolio, investment objectives, risk tolerance, liquidity needs and investment time horizon. This communication is provided for informational purposes only and is not an offer, recommendation, or solicitation to buy or sell any security or other investment. This communication does not constitute, nor should it be regarded as, investment research or a research report, a securities or investment recommendation, nor does it provide information reasonably sufficient upon which to base an investment decision. Additional analysis of your or your client’s specific parameters would be required to make an investment decision. This communication is not based on the investment objectives, strategies, goals, financial circumstances, needs or risk tolerance of any client or portfolio and is not presented as suitable to any other particular client or portfolio. Securities and investment advice offered through Investment Planners, Inc. (Member FINRA/SIPC) and IPI Wealth Management, Inc., 226 W. Eldorado Street, Decatur, IL 62522. 217-425-6340.[/et_pb_text][/et_pb_column]
[/et_pb_row]
[/et_pb_section]


Recent Comments