
The Week That Was
U.S. equity indexes finished lower as renewed Middle East tensions, higher oil prices and AI concerns overwhelmed strong early 2Q26 earnings results. The Nasdaq Composite fell 2.8%, the S&P 500 declined 1.5%, the DJIA lost 0.8%, and the Russell 2000 slipped 0.7%. Information technology (XLK) led the decline, down 5.5%, while Energy (XLE) gained 4.9%, Real Estate (XLRE) rose 2.1%, and Consumer Staples (XLP) and financials also advanced. Inflation data was materially cooler than expected as June headline CPI fell 0.4% m/m, its largest decline since April 2020, while core CPI was unchanged; headline inflation slowed to 3.5% y/y and core inflation to 2.6%. Headline PPI declined 0.3% m/m and core PPI rose 0.2%, both below consensus. The softer data provided a counterweight to renewed energy-driven inflation risk. June retail sales rose 0.2%, while sales excluding gas stations increased 0.7% and core retail sales rose 0.5%. Initial jobless claims fell to 208K, the lowest since early May, and continuing claims declined to 1.805M. Pending home sales dropped 5.4% m/m, homebuilder confidence weakened, and the average 30-year mortgage rate climbed to 6.55%. Preliminary July consumer sentiment improved to 54.4, though sentiment remained 12% below a year earlier.
Treasuries advanced on benign inflation data which outweighed the oil shock and hawkish Fed rhetoric. Two-year yields fell about 5 basis points to 4.16%, while the 10-year and 30-year yields held steady. During testimony in front of Congress, Fed Chair Kevin Warsh emphasized low tolerance for persistent inflation and limited forward guidance, but the market continued to view the bar for a hike as higher than the bar for holding rates steady. Commodities strengthened sharply on energy supply risk as WTI crude gained ~15.0% to end near $84 as six consecutive days of U.S.-Iran strikes restricted tanker traffic through the Strait of Hormuz. Natural gas fell 1.0%, gold declined 2.8%, and silver dropped 6.5%. The USD index was little changed.
U.S. Equity Market Summary — As of 7/17/26
| Asset Class | 1 Wk | 1 Mo | 3 Mo | YTD | 1 Yr | 3 Yr | 5 Yr |
|---|---|---|---|---|---|---|---|
| S&P 500 | -1.55% | 0.57% | 4.95% | 9.64% | 19.85% | 19.74% | 13.12% |
| Dow Jones Industrials Average | -0.93% | 1.31% | 5.88% | 9.43% | 19.18% | 16.77% | 10.58% |
| NASDAQ | -2.90% | -1.90% | 4.45% | 10.15% | 22.93% | 22.29% | 12.91% |
| S&P MidCap 400 | -0.13% | 0.79% | 3.86% | 15.02% | 20.61% | 13.65% | 9.27% |
| Russell 2000 | -0.52% | 1.60% | 6.97% | 20.09% | 33.07% | 16.51% | 7.96% |
| Russell Micro Cap | -2.05% | 1.76% | 6.21% | 22.06% | 44.43% | 21.08% | 7.72% |
U.S. Sector Summary — As of 7/17/26
| Cyclical Sectors | 1 Wk | 1 Mo | 3 Mo | YTD | 1 Yr | 3 Yr | 5 Yr |
|---|---|---|---|---|---|---|---|
| Consumer Cyclical | -1.54% | 0.16% | -3.93% | -2.94% | 5.65% | 10.44% | 6.21% |
| Financials | 0.99% | 4.45% | 7.68% | 3.60% | 8.79% | 19.48% | 11.17% |
| Materials | -0.71% | -2.50% | -2.24% | 12.33% | 14.31% | 8.70% | 6.59% |
| Real Estate | 2.18% | 4.19% | 3.00% | 14.30% | 12.59% | 9.35% | 3.03% |
| Sensitive Sectors | 1 Wk | 1 Mo | 3 Mo | YTD | 1 Yr | 3 Yr | 5 Yr |
|---|---|---|---|---|---|---|---|
| Comm. Services | -0.89% | 1.60% | -6.85% | -5.46% | 5.03% | 19.59% | 7.57% |
| Energy | 4.72% | 6.26% | 5.58% | 30.77% | 37.23% | 16.01% | 23.21% |
| Industrials | -1.38% | 0.14% | 3.65% | 16.26% | 19.70% | 19.77% | 13.67% |
| Technology | -5.49% | -5.38% | 13.90% | 22.26% | 35.22% | 26.19% | 19.39% |
| Defensive Sectors | 1 Wk | 1 Mo | 3 Mo | YTD | 1 Yr | 3 Yr | 5 Yr |
|---|---|---|---|---|---|---|---|
| Consumer Defensive | 1.27% | 2.52% | 4.03% | 11.05% | 7.96% | 7.66% | 6.47% |
| Health Care | 0.16% | 7.35% | 8.73% | 4.95% | 23.49% | 8.91% | 6.31% |
| Utilities | -0.53% | 2.24% | -1.52% | 7.22% | 12.71% | 14.36% | 9.63% |
US Equity Style Summary — As of 7/17/26
| Equity Style | 1 Wk | 1 Mo | 3 Mo | YTD | 1 Yr | 3 Yr | 5 Yr |
|---|---|---|---|---|---|---|---|
| Large Growth | -2.39% | -0.23% | 3.72% | 5.14% | 14.79% | 21.32% | 12.68% |
| Large Blend | -1.61% | 0.49% | 5.06% | 9.32% | 19.43% | 19.86% | 12.69% |
| Large Value | -0.59% | 1.40% | 7.24% | 15.33% | 25.14% | 17.77% | 12.39% |
| Mid Growth | -2.94% | -2.47% | 3.58% | 5.49% | 2.98% | 12.16% | 5.53% |
| Mid Blend | -0.86% | 1.21% | 4.88% | 11.41% | 14.95% | 14.18% | 8.23% |
| Mid Value | 0.73% | 4.08% | 5.82% | 15.57% | 24.15% | 15.37% | 10.44% |
| Small Growth | -2.65% | -1.46% | 2.62% | 14.38% | 21.95% | 13.87% | 5.11% |
| Small Blend | -0.62% | 1.42% | 4.36% | 15.62% | 23.24% | 14.72% | 8.15% |
| Small Value | 0.89% | 3.57% | 5.62% | 16.47% | 24.11% | 15.31% | 10.29% |
International Equity Market Summary — As of 7/17/26
European equities were mixed as the STOXX Europe 600 edged up 0.1%, the DAX fell 0.9%, France's CAC 40 was flat, and the FTSE 100 gained 1.0%. June eurozone inflation slowed to 2.8% from 3.2%, still above the ECB's 2% target, while May industrial production fell 0.2% m/m. German wholesale prices rose 4.9% y/y. Andy Burnham formally became Labour leader Friday and is set to become U.K. prime minister on July 20. The U.K. economy grew 0.1% in May, while industrial production fell 0.5%.
Japan suffered heavy equity losses as the global semiconductor selloff and higher oil prices hit risk appetite as the Nikkei 225 dropped 6.4% and the TOPIX fell 2.9%. The yen weakened to ~JPY 162.3 per USD, while the 10-year JGB yield declined to 2.70% from 2.78% after the government's final economic blueprint affirmed BoJ independence. Core machinery orders fell 12.4% m/m in May, far worse than expected, signaling broad business investment weakness. Reuters Tankan manufacturing sentiment held at +13, while nonmanufacturing sentiment fell to +25 from +32.
China equities also fell sharply as the CSI 300 was lower by 5.3% and the Shanghai Composite dropped 5.8% as AI, memory-chip, and semiconductor shares sold off. Second-quarter GDP grew 4.3% y/y, below consensus and down from 5.0% in the first quarter. June industrial production rose 5.3%, retail sales increased only 1.0%, and first-half fixed asset investment fell 5.7%, including an 18.0% decline in property investment. However, China's June exports surged 27.0% y/y in USD terms and imports increased 36.0%, widening the trade surplus to $125.6B. Strong semiconductor pricing and overseas demand for data-processing equipment and autos contrasted with weak domestic consumption, investment, and property activity. The mix highlighted continued reliance on external demand and limited private-sector borrowing appetite. Hong Kong's Hang Seng gained 1.6% on mainland buying and strength outside technology.
| Region | 1 Wk | 1 Mo | 3 Mo | YTD | 1 Yr | 3 Yr | 5 Yr |
|---|---|---|---|---|---|---|---|
| MSCI ACWI | -1.58% | -1.00% | 3.68% | 10.39% | 21.74% | 18.97% | 11.27% |
| MSCI ACWI ex USA | -1.72% | -3.91% | 1.11% | 11.44% | 25.13% | 17.03% | 8.56% |
| MSCI Emerging Markets | -4.10% | -8.84% | 2.16% | 16.71% | 32.95% | 18.97% | 6.42% |
| MSCI Europe Stock | 0.08% | -0.86% | 0.45% | 7.63% | 18.72% | 15.34% | 9.47% |
| MSCI Asia Pacific Stock | -3.75% | -7.25% | 3.06% | 15.92% | 30.85% | 18.22% | 7.38% |
| MSCI Latin America Stock | -1.35% | -0.39% | -9.71% | 12.08% | 36.92% | 12.27% | 9.59% |
Chart of the Week — 7/20/26
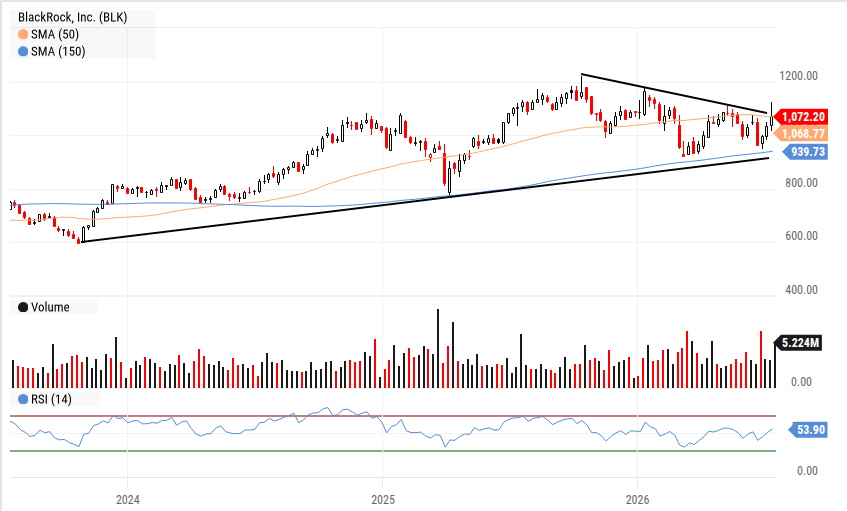
BLK has been in a fairly orderly uptrend for the past few years, albeit with some pullbacks to support. With the recent strength in Financials, BLK appears to be ready to break from an intermediate downturn. We believe the stock should be owned with a move to $1200 (old highs) possible.
The Week Ahead
Earnings season blossoms for the SPX with 87 companies spanning all industries set to report. According to Factset, 2Q26 Y/Y earnings growth is expected at 24.7%, with NVDA and MU responsible for 800 bp's of the EPS growth. However, even without those two involved, EPS growth would be almost 17%, still very much above trend EPS growth over the past decade of ~11%. On the earnings front, HAL (Tues) and SLB (Fri) will have an interesting time discussing business trends as military action in the Middle East appears back on the front burner and oil prices have responded, but the market seems to be discounting that negotiations will begin anew and/or that supplies are finding new ways to the market.
GEV (Wed) will likely continue to show robust bookings for power generation equipment as the AI buildout continues while GOOGL (Wed) will be the first of the hyper-scalers to update its 2026, and perhaps 2027, capex while also highlighting demand for Google Cloud and its merchant chip business. INTC (Thur) will hope to convince investors that its foundry business, with help from the US government, remains on track to be relevant at advanced nodes. IBM (Wed) has already pre-announced that it is “off-track” in part owing to slowing software growth. That puts a spotlight on NOW (Wed) which disappointed with growth forecasts last quarter despite arguing it is squarely in the lane for agentic AI spend.
BX (Thur) will attempt to dispel the “doom loop” that is private credit – if BLK is any indication from last week, new flows will continue strong despite investor gates being the overwhelming narrative. AXP (Fri) should continue the strong narrative from financial companies, and its 1Q26 earnings report, which highlighted strong growth in luxury retail spend.
| Company | Date | EPS Est. |
|---|---|---|
| Domino's Pizza, Inc. (DPZ) | Mon Jul 20 | $4.37 |
| Wintrust Financial Corp. (WTFC) | Mon Jul 20 | $3.30 |
| General Motors Co. (GM) | Tue Jul 21 | $3.26 |
| Halliburton Co. (HAL) | Tue Jul 21 | $0.61 |
| The Charles Schwab Corp. (SCHW) | Tue Jul 21 | $1.62 |
| GE Vernova, Inc. (GEV) | Wed Jul 22 | $4.26 |
| Alphabet, Inc. (GOOGL) | Wed Jul 22 | $3.01 |
| Intl Business Machines Corp. (IBM) | Wed Jul 22 | $2.85 |
| ServiceNow, Inc. (NOW) | Wed Jul 22 | $1.09 |
| Tesla, Inc. (TSLA) | Wed Jul 22 | $0.55 |
| Blackstone, Inc. (BX) | Thu Jul 23 | $1.45 |
| Intel Corp. (INTC) | Thu Jul 23 | $0.27 |
| American Express Co. (AXP) | Fri Jul 24 | $4.59 |
| SLB Ltd. (SLB) | Fri Jul 24 | $0.65 |
| Verizon Communications, Inc. (VZ) | Fri Jul 24 | $1.29 |
| Data Release | Date | Est. |
|---|---|---|
| 3 & 6 Month Bill Auction | Mon Jul 20 | N/A |
| Conference Board Leading Economic Index | Mon Jul 20 | N/A |
| Redbook Retail Sales Y/Y | Tue Jul 21 | N/A |
| US Mortgage Purchase | Wed Jul 22 | N/A |
| US Crude Oil Stocks | Wed Jul 22 | N/A |
| Chicago Fed National Activity Index | Thu Jul 23 | 6.20 |
| US Initial Claims for Unemployment Insurance | Thu Jul 23 | 210K |
| US Total Assets — All Federal Reserve Banks | Thu Jul 23 | N/A |
| S&P Global Composite PMI Flash | Fri Jul 24 | 51.5 |
| US New Single Family Houses Sold | Fri Jul 24 | 600K |
| US Oil Rig Count | Fri Jul 24 | N/A |
| US Index of Consumer Sentiment | Fri Jul 31 | 50.4 |
Key Interest Rates — As of 7/17/26
| Rate | As of | Latest | 1 Mo Ago | 1 Mo % | 1 Yr Ago | 1 Yr % |
|---|---|---|---|---|---|---|
| 1 Month Treasury | 7/17/26 | 3.73% | 3.68% | 1.4% | 4.36% | -14.4% |
| 2 Year Treasury | 7/17/26 | 4.18% | 4.20% | -0.5% | 3.91% | 6.9% |
| 10 Year Treasury | 7/17/26 | 4.55% | 4.49% | 1.3% | 4.47% | 1.8% |
| 30 Year Mortgage | 7/16/26 | 6.55% | 6.52% | 0.5% | 6.72% | -2.5% |
| US Corporate AAA | 7/16/26 | 5.18% | 5.00% | 3.6% | 4.90% | 5.7% |
| US Corporate BBB | 7/16/26 | 5.45% | 5.31% | 2.6% | 5.33% | 2.3% |
| US Corporate CCC | 7/16/26 | 13.86% | 13.56% | 2.2% | 12.53% | 10.6% |
| Effective Fed Funds | 7/16/26 | 3.63% | 3.63% | 0.0% | 4.33% | -16.2% |
US Economy Indicators
| Indicator | As of | Latest | 1 Mo Ago | 1 Mo % | 1 Yr Ago | 1 Yr % |
|---|---|---|---|---|---|---|
| Consumer Sentiment | 6/30/26 | 49.50 | 49.80 | -0.6% | 60.70 | -18.5% |
| Unemployment Rate | 6/30/26 | 4.20% | 4.30% | -2.3% | 4.10% | 2.4% |
| Inflation Rate | 6/30/26 | 3.50% | 3.80% | -7.9% | 2.70% | 29.6% |
| Manufacturing PMI | 6/30/26 | 53.30 | 52.70 | 1.1% | 49.00 | 8.8% |
| Non Manufacturing PMI | 6/30/26 | 54.00 | 53.60 | 0.7% | 50.80 | 6.3% |
| Retail Sales | 6/30/26 | 666,056 | 657,830 | 1.3% | 621,374 | 7.2% |
| Building Permits | 6/30/26 | 1,367 | 1,423 | -3.9% | 1,399 | -2.3% |
Suggested Readings
- 1SpaceX Ignites All 33 Powerful Engines on Booster Ahead of Flight 13 Launch
- 2Richmond Fed: Is the U.S. Economy K-Shaped? Evidence From the Past Three Decades
- 3Kimi: Threat or Menace?
- 4"Let the AI Do It": Former Air Force Secretary Pits Machine Against Human Operators
- 5A Long Run Economic Model For Projecting the Finances of the U.S. Government and National Spending on Healthcare
Leadership Insight
“...no reason '27 should diverge from that double-digit commercial services growth, medium term outlook, even as we go into next year with what will clearly be a higher jumping off point than we imagined. Again, the environment is dynamic, we're mindful of that. But with our backlog, with that framework, that algorithm in place, and just the overall tone we're hearing from customers, I think we feel very good about where we are at this point.”
Stocks to Watch
For our full list of Stocks To Watch, contact Patrick Mullin at pmullin@timberpointcapital.com
U.S. equity indexes finished lower as renewed Middle East tensions, higher oil prices and AI concerns overwhelmed strong early 2Q26 earnings results. The Nasdaq Composite fell 2.8%, the S&P 500 declined 1.5%, the DJIA lost 0.8%, and the Russell 2000 slipped 0.7%. Information technology (XLK) led the decline, down 5.5%, while Energy (XLE) gained 4.9%, Real Estate (XLRE) rose 2.1%, and Consumer Staples (XLP) and financials also advanced. Inflation data was materially cooler than expected as June headline CPI fell 0.4% m/m, its largest decline since April 2020, while core CPI was unchanged; headline inflation slowed to 3.5% y/y and core inflation to 2.6%. Headline PPI declined 0.3% m/m and core PPI rose 0.2%, both below consensus. The softer data provided a counterweight to renewed energy-driven inflation risk. June retail sales rose 0.2%, while sales excluding gas stations increased 0.7% and core retail sales rose 0.5%. Initial jobless claims fell to 208K, the lowest since early May, and continuing claims declined to 1.805M. Pending home sales dropped 5.4% m/m, homebuilder confidence weakened, and the average 30-year mortgage rate climbed to 6.55%. Preliminary July consumer sentiment improved to 54.4, though sentiment remained 12% below a year earlier.
Treasuries advanced on benign inflation data which outweighed the oil shock and hawkish Fed rhetoric. Two-year yields fell about 5 basis points to 4.16%, while the 10-year and 30-year yields held steady. During testimony in front of Congress, Fed Chair Kevin Warsh emphasized low tolerance for persistent inflation and limited forward guidance, but the market continued to view the bar for a hike as higher than the bar for holding rates steady. Commodities strengthened sharply on energy supply risk as WTI crude gained ~15.0% to end near $84 as six consecutive days of U.S.-Iran strikes restricted tanker traffic through the Strait of Hormuz. Natural gas fell 1.0%, gold declined 2.8%, and silver dropped 6.5%. The USD index was little changed.
| Asset Class | 1 Wk | 1 Mo | 3 Mo | YTD | 1 Yr | 3 Yr | 5 Yr |
|---|---|---|---|---|---|---|---|
| S&P 500 | -1.55% | 0.57% | 4.95% | 9.64% | 19.85% | 19.74% | 13.12% |
| Dow Jones Industrials Average | -0.93% | 1.31% | 5.88% | 9.43% | 19.18% | 16.77% | 10.58% |
| NASDAQ | -2.90% | -1.90% | 4.45% | 10.15% | 22.93% | 22.29% | 12.91% |
| S&P MidCap 400 | -0.13% | 0.79% | 3.86% | 15.02% | 20.61% | 13.65% | 9.27% |
| Russell 2000 | -0.52% | 1.60% | 6.97% | 20.09% | 33.07% | 16.51% | 7.96% |
| Russell Micro Cap | -2.05% | 1.76% | 6.21% | 22.06% | 44.43% | 21.08% | 7.72% |
| Sector | 1Wk | YTD |
|---|---|---|
| -1.54% | -2.94% | |
| 0.99% | 3.60% | |
| -0.71% | 12.33% | |
| 2.18% | 14.30% |
| Sector | 1Wk | YTD |
|---|---|---|
| -0.89% | -5.46% | |
| 4.72% | 30.77% | |
| -1.38% | 16.26% | |
| -5.49% | 22.26% |
| Sector | 1Wk | YTD |
|---|---|---|
| 1.27% | 11.05% | |
| 0.16% | 4.95% | |
| -0.53% | 7.22% |
| Style | 1 Wk | 1 Mo | 3 Mo | YTD | 1 Yr | 3 Yr | 5 Yr |
|---|---|---|---|---|---|---|---|
| Large Growth | -2.39% | -0.23% | 3.72% | 5.14% | 14.79% | 21.32% | 12.68% |
| Large Blend | -1.61% | 0.49% | 5.06% | 9.32% | 19.43% | 19.86% | 12.69% |
| Large Value | -0.59% | 1.40% | 7.24% | 15.33% | 25.14% | 17.77% | 12.39% |
| Mid Growth | -2.94% | -2.47% | 3.58% | 5.49% | 2.98% | 12.16% | 5.53% |
| Mid Blend | -0.86% | 1.21% | 4.88% | 11.41% | 14.95% | 14.18% | 8.23% |
| Mid Value | 0.73% | 4.08% | 5.82% | 15.57% | 24.15% | 15.37% | 10.44% |
| Small Growth | -2.65% | -1.46% | 2.62% | 14.38% | 21.95% | 13.87% | 5.11% |
| Small Blend | -0.62% | 1.42% | 4.36% | 15.62% | 23.24% | 14.72% | 8.15% |
| Small Value | 0.89% | 3.57% | 5.62% | 16.47% | 24.11% | 15.31% | 10.29% |
Earnings season blossoms for the SPX with 87 companies spanning all industries set to report. According to Factset, 2Q26 Y/Y earnings growth is expected at 24.7%, with NVDA and MU responsible for 800 bp's of the EPS growth. However, even without those two involved, EPS growth would be almost 17%, still very much above trend EPS growth over the past decade of ~11%. On the earnings front, HAL (Tues) and SLB (Fri) will have an interesting time discussing business trends as military action in the Middle East appears back on the front burner and oil prices have responded, but the market seems to be discounting that negotiations will begin anew and/or that supplies are finding new ways to the market.
GEV (Wed) will likely continue to show robust bookings for power generation equipment as the AI buildout continues while GOOGL (Wed) will be the first of the hyper-scalers to update its 2026, and perhaps 2027, capex while also highlighting demand for Google Cloud and its merchant chip business. INTC (Thur) will hope to convince investors that its foundry business, with help from the US government, remains on track to be relevant at advanced nodes. IBM (Wed) has already pre-announced that it is “off-track” in part owing to slowing software growth. That puts a spotlight on NOW (Wed) which disappointed with growth forecasts last quarter despite arguing it is squarely in the lane for agentic AI spend.
BX (Thur) will attempt to dispel the “doom loop” that is private credit – if BLK is any indication from last week, new flows will continue strong despite investor gates being the overwhelming narrative. AXP (Fri) should continue the strong narrative from financial companies, and its 1Q26 earnings report, which highlighted strong growth in luxury retail spend.
| Company | Date | EPS Est. |
|---|---|---|
| Domino's Pizza, Inc. (DPZ) | Mon Jul 20 | $4.37 |
| Wintrust Financial Corp. (WTFC) | Mon Jul 20 | $3.30 |
| General Motors Co. (GM) | Tue Jul 21 | $3.26 |
| Halliburton Co. (HAL) | Tue Jul 21 | $0.61 |
| The Charles Schwab Corp. (SCHW) | Tue Jul 21 | $1.62 |
| GE Vernova, Inc. (GEV) | Wed Jul 22 | $4.26 |
| Alphabet, Inc. (GOOGL) | Wed Jul 22 | $3.01 |
| Intl Business Machines Corp. (IBM) | Wed Jul 22 | $2.85 |
| ServiceNow, Inc. (NOW) | Wed Jul 22 | $1.09 |
| Tesla, Inc. (TSLA) | Wed Jul 22 | $0.55 |
| Blackstone, Inc. (BX) | Thu Jul 23 | $1.45 |
| Intel Corp. (INTC) | Thu Jul 23 | $0.27 |
| American Express Co. (AXP) | Fri Jul 24 | $4.59 |
| SLB Ltd. (SLB) | Fri Jul 24 | $0.65 |
| Verizon Communications, Inc. (VZ) | Fri Jul 24 | $1.29 |
| Data Release | Date | Est. |
|---|---|---|
| 3 & 6 Month Bill Auction | Mon Jul 20 | N/A |
| Conference Board Leading Economic Index | Mon Jul 20 | N/A |
| Redbook Retail Sales Y/Y | Tue Jul 21 | N/A |
| US Mortgage Purchase | Wed Jul 22 | N/A |
| US Crude Oil Stocks | Wed Jul 22 | N/A |
| Chicago Fed National Activity Index | Thu Jul 23 | 6.20 |
| US Initial Claims for Unemployment Insurance | Thu Jul 23 | 210K |
| US Total Assets — All Federal Reserve Banks | Thu Jul 23 | N/A |
| S&P Global Composite PMI Flash | Fri Jul 24 | 51.5 |
| US New Single Family Houses Sold | Fri Jul 24 | 600K |
| US Oil Rig Count | Fri Jul 24 | N/A |
| US Index of Consumer Sentiment | Fri Jul 31 | 50.4 |
European equities were mixed as the STOXX Europe 600 edged up 0.1%, the DAX fell 0.9%, France's CAC 40 was flat, and the FTSE 100 gained 1.0%. June eurozone inflation slowed to 2.8% from 3.2%, still above the ECB's 2% target, while May industrial production fell 0.2% m/m. German wholesale prices rose 4.9% y/y. Andy Burnham formally became Labour leader Friday and is set to become U.K. prime minister on July 20. The U.K. economy grew 0.1% in May, while industrial production fell 0.5%.
Japan suffered heavy equity losses as the global semiconductor selloff and higher oil prices hit risk appetite as the Nikkei 225 dropped 6.4% and the TOPIX fell 2.9%. The yen weakened to ~JPY 162.3 per USD, while the 10-year JGB yield declined to 2.70% from 2.78% after the government's final economic blueprint affirmed BoJ independence. Core machinery orders fell 12.4% m/m in May, far worse than expected, signaling broad business investment weakness. Reuters Tankan manufacturing sentiment held at +13, while nonmanufacturing sentiment fell to +25 from +32.
China equities also fell sharply as the CSI 300 was lower by 5.3% and the Shanghai Composite dropped 5.8% as AI, memory-chip, and semiconductor shares sold off. Second-quarter GDP grew 4.3% y/y, below consensus and down from 5.0% in the first quarter. June industrial production rose 5.3%, retail sales increased only 1.0%, and first-half fixed asset investment fell 5.7%, including an 18.0% decline in property investment. However, China's June exports surged 27.0% y/y in USD terms and imports increased 36.0%, widening the trade surplus to $125.6B. Hong Kong's Hang Seng gained 1.6% on mainland buying and strength outside technology.
| Region | 1 Wk | 1 Mo | 3 Mo | YTD | 1 Yr | 3 Yr | 5 Yr |
|---|---|---|---|---|---|---|---|
| MSCI ACWI | -1.58% | -1.00% | 3.68% | 10.39% | 21.74% | 18.97% | 11.27% |
| MSCI ACWI ex USA | -1.72% | -3.91% | 1.11% | 11.44% | 25.13% | 17.03% | 8.56% |
| MSCI Emerging Markets | -4.10% | -8.84% | 2.16% | 16.71% | 32.95% | 18.97% | 6.42% |
| MSCI Europe Stock | 0.08% | -0.86% | 0.45% | 7.63% | 18.72% | 15.34% | 9.47% |
| MSCI Asia Pacific Stock | -3.75% | -7.25% | 3.06% | 15.92% | 30.85% | 18.22% | 7.38% |
| MSCI Latin America Stock | -1.35% | -0.39% | -9.71% | 12.08% | 36.92% | 12.27% | 9.59% |
| Rate | Latest | 1 Mo Ago | 1 Mo % | 1 Yr Ago | 1 Yr % |
|---|---|---|---|---|---|
| 1 Month Treasury | 3.73% | 3.68% | 1.4% | 4.36% | -14.4% |
| 2 Year Treasury | 4.18% | 4.20% | -0.5% | 3.91% | 6.9% |
| 10 Year Treasury | 4.55% | 4.49% | 1.3% | 4.47% | 1.8% |
| 30 Year Mortgage | 6.55% | 6.52% | 0.5% | 6.72% | -2.5% |
| US Corporate AAA | 5.18% | 5.00% | 3.6% | 4.90% | 5.7% |
| US Corporate BBB | 5.45% | 5.31% | 2.6% | 5.33% | 2.3% |
| US Corporate CCC | 13.86% | 13.56% | 2.2% | 12.53% | 10.6% |
| Effective Fed Funds | 3.63% | 3.63% | 0.0% | 4.33% | -16.2% |
| Indicator | Latest | 1 Mo Ago | 1 Mo % | 1 Yr Ago | 1 Yr % |
|---|---|---|---|---|---|
| Consumer Sentiment | 49.50 | 49.80 | -0.6% | 60.70 | -18.5% |
| Unemployment Rate | 4.20% | 4.30% | -2.3% | 4.10% | 2.4% |
| Inflation Rate | 3.50% | 3.80% | -7.9% | 2.70% | 29.6% |
| Manufacturing PMI | 53.30 | 52.70 | 1.1% | 49.00 | 8.8% |
| Non Manufacturing PMI | 54.00 | 53.60 | 0.7% | 50.80 | 6.3% |
| Retail Sales | 666,056 | 657,830 | 1.3% | 621,374 | 7.2% |
| Building Permits | 1,367 | 1,423 | -3.9% | 1,399 | -2.3% |
BLK has been in a fairly orderly uptrend for the past few years, albeit with some pullbacks to support. With the recent strength in Financials, BLK appears to be ready to break from an intermediate downturn. We believe the stock should be owned with a move to $1200 (old highs) possible.
“...no reason '27 should diverge from that double-digit commercial services growth, medium term outlook, even as we go into next year with what will clearly be a higher jumping off point than we imagined. Again, the environment is dynamic, we're mindful of that. But with our backlog, with that framework, that algorithm in place, and just the overall tone we're hearing from customers, I think we feel very good about where we are at this point.”
For our full list of Stocks To Watch, contact Patrick Mullin at pmullin@timberpointcapital.com
©2020 YCharts, Inc. All Rights Reserved. YCharts, Inc. ("YCharts") is not registered with the U.S. Securities and Exchange Commission as an investment adviser, broker-dealer or in any other capacity, and does not purport to provide investment advice or make investment recommendations. This report has been generated through application of the analytical tools and data provided through ycharts.com and is intended solely to assist you or your investment or other adviser(s) in conducting investment research.
All data, statistics and charts are courtesy of YCharts unless otherwise noted. Investment Advice is offered through Fortis Capital Advisors, LLC, 7301 Mission Road, Suite 326, Prairie Village, KS 66208.
While reasonable efforts were used to obtain information from sources believed to be reliable, Fortis Capital Advisors, LLC makes no representation that the information or opinions contained in this material are accurate, reliable, or complete. All information and opinions are subject to change without notice. You should not construe this report as an offer to buy or sell, as a solicitation of an offer to buy or sell, or as a recommendation to buy, sell, hold or trade, any security or other financial instrument.
Past performance is not indicative of future results. Investing involves risk, including the possible loss of principal. The information contained herein is provided for informational purposes only and should not be construed as investment, tax, or legal advice. Recipients should consult their own advisers before making any investment decisions.
Source: Timber Point Capital Management. Powered by Fortis Capital Advisors. Investment Advice is offered through Fortis Capital Advisors, LLC, 7301 Mission Road, Suite 326, Prairie Village, KS 66208. All rights reserved.