
The Week That Was
U.S. equities finished lower as concerns about the costs and prospective returns of heavy AI investment, higher oil prices, and rising Treasury yields outweighed generally strong early 2Q26 earnings. The Nasdaq declined 2.1%, the SPX fell 0.6%, the DJIA lost 0.4%, and the R2K slipped 1.1%. Consumer Discretionary (XLY) and Communication Services (XLC) were the weakest sectors, down 5.2% and 3.9%, respectively, while Energy (XLE) gained 3.3%. Utilities, Industrials, Real Estate, Materials, and Health Care also advanced, while Technology was slightly better than flat. Value stocks across the market cap spectrum outperformed growth stocks. GOOGL reported strong results, including 82% y/y cloud revenue growth, but raised 2026 capital-spending guidance to $195-$205B and indicated that 2027 spending would rise significantly. Investors were spooked by the reported negative quarterly free cash flow of $5.9B, its first negative quarter since becoming public, and unimpressed by the latest Gemini model release. TSLA declined by ~15% as it disclosed its first cash burn in two years and forecast larger future outlays which unsettled investors. Economic data remained resilient as the S&P Global Services PMI rose to 53.6 in July from 51.2, lifting the Composite PMI to an eight-month high, while manufacturing moderated slightly to 53.8. Initial jobless claims fell to 187K, the lowest reading since 1969, and continuing claims edged down to 1.796M. New-home sales increased 1.6% m/m to an annualized 628K, although they remained 5.6% below year-ago levels and the median sales price declined to $398,300. Treasury prices declined as higher oil prices renewed inflation concerns and increased expectations for additional Fed tightening. Two-year yields rose about 10 basis points to 4.31% and 10-year yields increased roughly 17 basis points to 4.71%, the highest 10-year level since Jan '25. Oil gained 8.6% for the week despite a Friday pullback on possible new negotiations, while gold rose 0.8%, silver gained 4.0%, and natural gas fell 1.1%.
U.S. Equity Market Summary — As of 7/24/26
| Asset Class | 1 Wk | 1 Mo | 3 Mo | YTD | 1 Yr | 3 Yr | 5 Yr |
|---|---|---|---|---|---|---|---|
| S&P 500 | -0.60% | 0.81% | 3.74% | 8.99% | 17.88% | 19.21% | 12.54% |
| Dow Jones Industrials Average | -0.38% | 0.26% | 5.94% | 9.05% | 18.16% | 15.70% | 10.26% |
| NASDAQ | -2.13% | -1.95% | 0.71% | 7.80% | 19.33% | 21.95% | 11.79% |
| S&P MidCap 400 | 0.23% | -0.03% | 4.25% | 15.29% | 20.28% | 13.49% | 8.87% |
| Russell 2000 | -1.09% | -1.81% | 5.43% | 18.79% | 31.71% | 15.80% | 7.26% |
| Russell Micro Cap | -2.24% | -2.49% | 4.36% | 19.33% | 39.73% | 20.04% | 6.93% |
U.S. Sector Summary — As of 7/24/26
| Cyclical Sectors | 1 Wk | 1 Mo | 3 Mo | YTD | 1 Yr | 3 Yr | 5 Yr |
|---|---|---|---|---|---|---|---|
| Consumer Cyclical | -5.22% | -4.92% | -7.63% | -8.01% | -1.03% | 9.22% | 4.46% |
| Financials | 0.09% | 4.82% | 9.89% | 3.70% | 7.74% | 18.36% | 11.11% |
| Materials | 1.44% | 0.20% | -0.90% | 13.95% | 14.33% | 8.93% | 6.72% |
| Real Estate | 1.17% | 3.24% | 5.74% | 15.63% | 11.06% | 9.29% | 3.24% |
| Sensitive Sectors | 1 Wk | 1 Mo | 3 Mo | YTD | 1 Yr | 3 Yr | 5 Yr |
|---|---|---|---|---|---|---|---|
| Comm. Services | -3.93% | -0.23% | -7.75% | -9.17% | -0.91% | 18.73% | 6.03% |
| Energy | 3.36% | 11.29% | 5.58% | 35.17% | 40.60% | 15.27% | 24.11% |
| Industrials | 1.81% | 1.36% | 6.17% | 18.37% | 20.54% | 20.20% | 13.71% |
| Technology | 0.17% | -3.92% | 9.90% | 22.46% | 35.27% | 26.69% | 18.77% |
| Defensive Sectors | 1 Wk | 1 Mo | 3 Mo | YTD | 1 Yr | 3 Yr | 5 Yr |
|---|---|---|---|---|---|---|---|
| Consumer Defensive | -1.24% | -0.37% | 1.79% | 9.67% | 6.29% | 6.33% | 6.09% |
| Health Care | 0.92% | 6.01% | 13.25% | 5.91% | 21.83% | 7.93% | 6.04% |
| Utilities | 2.48% | 1.65% | 0.88% | 9.88% | 12.86% | 14.04% | 10.35% |
US Equity Style Summary — As of 7/24/26
| Equity Style | 1 Wk | 1 Mo | 3 Mo | YTD | 1 Yr | 3 Yr | 5 Yr |
|---|---|---|---|---|---|---|---|
| Large Growth | -2.12% | -0.27% | 0.39% | 2.91% | 11.30% | 20.93% | 11.47% |
| Large Blend | -0.64% | 0.76% | 3.79% | 8.61% | 17.44% | 19.34% | 12.05% |
| Large Value | 1.43% | 2.09% | 9.16% | 16.98% | 25.53% | 17.19% | 12.52% |
| Mid Growth | -0.43% | -2.93% | 3.31% | 5.04% | 1.23% | 12.33% | 4.66% |
| Mid Blend | 0.38% | 0.88% | 5.32% | 11.83% | 13.71% | 14.12% | 7.77% |
| Mid Value | 0.97% | 3.83% | 6.79% | 16.70% | 23.37% | 15.02% | 10.40% |
| Small Growth | -0.91% | -3.58% | 1.92% | 13.34% | 20.33% | 13.90% | 4.23% |
| Small Blend | -0.35% | -0.36% | 4.41% | 15.21% | 22.01% | 14.39% | 7.58% |
| Small Value | 0.04% | 2.05% | 6.21% | 16.52% | 23.14% | 14.68% | 9.97% |
International Equity Market Summary — As of 7/24/26
International equity markets gained despite ongoing angst about the Middle East and higher oil prices. In Europe, the STOXX Europe 600 gained 0.5%, Germany's DAX rose 1.1%, France's CAC 40 advanced 0.4% and the UK's FTSE 100 gained 1.3% fueled by positive corporate earnings and improving business activity. The Eurozone manufacturing PMI increased to 52.0 and services returned to expansion at 51.6, resulting in a Composite PMI (51.5) that was the highest since Feb '26. The ECB left rates unchanged but kept the door open to further tightening. Japan's Nikkei 225 gained 0.7%, while the broader TOPIX advanced 2.4%. Financial shares benefited from rising JGB yields and expectations for additional BoJ tightening, while technology and semiconductor shares were volatile. The 10-year JGB yield rose to 2.80% from 2.70%, while the yen weakened toward JPY 164 per USD, near a 40-year low. Higher oil prices, continued yen weakness, and U.S. tariff developments all weighed on sentiment despite index increases. Mainland Chinese equities advanced led by the CSI 300 rise of 2.7% and the Shanghai Composite's gain of 1.3%, supported by state-backed purchases and renewed interest in domestic AI and semiconductor shares. State-owned capital platforms disclosed nearly RMB 60B of equity purchases, major insurers announced plans to raise long-term equity allocations, and the PBoC supplied additional medium-term liquidity. The measures suggested targeted market support rather than a broad new stimulus program. Hong Kong's Hang Seng gained 1.6% on strength in technology-related shares despite Friday's regional risk-off move.
| Region | 1 Wk | 1 Mo | 3 Mo | YTD | 1 Yr | 3 Yr | 5 Yr |
|---|---|---|---|---|---|---|---|
| MSCI ACWI | -0.29% | 0.21% | 3.59% | 10.08% | 19.44% | 18.73% | 10.96% |
| MSCI ACWI ex USA | 0.38% | -0.92% | 3.02% | 11.86% | 22.27% | 17.24% | 8.73% |
| MSCI Emerging Markets | 0.48% | -5.67% | 1.79% | 17.27% | 30.82% | 19.70% | 6.98% |
| MSCI Europe Stock | -0.04% | 1.80% | 3.71% | 7.58% | 16.02% | 15.20% | 9.24% |
| MSCI Asia Pacific Stock | 0.82% | -4.05% | 3.54% | 16.87% | 27.19% | 19.02% | 7.96% |
| MSCI Latin America Stock | 1.36% | 4.78% | -5.47% | 13.60% | 39.43% | 11.65% | 10.26% |
Chart of the Week — 7/27/26
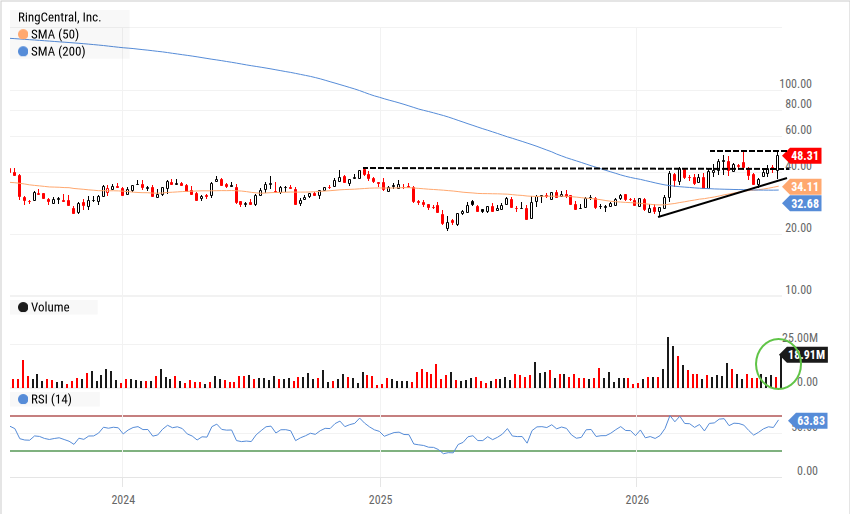
RNG has been in a multi-year basing period and most recently has been putting in higher lows. Last week's big move on heavy volume pushed the stock through intermediate resistance levels and it is now contending with limited near term resistance. We believe the stage is set for a meaningful move higher in the near future.
The Week Ahead
A positive backdrop for the week as yet another attempt at peace takes place in the Middle East this morning as the US and Iran agree to halt strikes which causes oil prices to drop into the mid $80 range. Whether this extends to the Houthi forces in Yemen that have recently claimed attacks on Saudi ports remains to be seen.
Back home, we have a very busy week on tap with FOMC activity (Wed), PCE inflation data (Thur), and mega-cap technology earnings (AAPL, AMZN, META, MSFT) that likely continue to highlight the large capital dollars being thrown at AI initiatives. Following GOOGL's negative market reaction, investors will be focused less on revenue beats than capital-spending plans, free-cash-flow trends and evidence that AI investment is producing measurable ROI with the entire AI infrastructure eco-system in the crosshairs of negative sentiment. Also adding to the AI mosaic will be earnings from ARM, LRCX, QCOM and STX. Outside technology, results from V, MA, PYPL, SBUX and CMG will offer insight into consumer spending, credit conditions and discretionary demand.
The FOMC meets Tuesday and Wednesday, with its policy statement due Wednesday afternoon. The Fed likely leaves rates unchanged with investors focused on Chair Kevin Warsh's assessment of higher oil prices, economic activity and the potential inflationary effects of the AI infrastructure boom. A hawkish tone from the FOMC could place further upward pressure on Treasury yields and weigh on growth-stock valuations. Thursday brings the release of personal income, consumer spending and the Fed's preferred PCE inflation measures. The combination should provide a clearer picture of how resilient the consumer remains in the wake of higher oil/gasoline prices and whether inflation is spreading beyond the energy complex. Elevated inflation, along with still strong economic growth, would reinforce the higher-for-longer rate narrative, while softer data could provide some relief to bonds and rate-sensitive equities. Friday's employment cost index will put a spotlight on wage and benefit increases in both the private and public sector with employment cost growth currently running at 3.4%.
| Company | Date | EPS Est. |
|---|---|---|
| F5, Inc. (FFIV) | Mon Jul 27 | $4.14 |
| The Boeing Co. (BA) | Tue Jul 28 | ($0.11) |
| Hilton Worldwide Holdings, Inc. (HLT) | Tue Jul 28 | $2.43 |
| KLA Corp. (KLAC) | Tue Jul 28 | $1.13 |
| General Dynamics Corp. (GD) | Wed Jul 29 | $4.07 |
| Microsoft Corp. (MSFT) | Wed Jul 29 | $4.61 |
| Meta Platforms, Inc. (META) | Wed Jul 29 | $7.36 |
| Starbucks Corp. (SBUX) | Wed Jul 29 | $0.68 |
| Bristol Myers Squibb Co. (BMY) | Thu Jul 30 | $1.61 |
| Mastercard, Inc. (MA) | Thu Jul 30 | $5.11 |
| Amazon.com, Inc. (AMZN) | Thu Jul 30 | $1.90 |
| Apple, Inc. (AAPL) | Thu Jul 30 | $2.01 |
| Reddit, Inc. (RDDT) | Thu Jul 30 | $1.77 |
| AbbVie, Inc. (ABBV) | Fri Jul 31 | $3.84 |
| Chevron Corp. (CVX) | Fri Jul 31 | $4.26 |
| Exxon Mobil Corp. (XOM) | Fri Jul 31 | $3.34 |
| Data Release | Date | Est. |
|---|---|---|
| US Durable Goods Shipments YoY | Mon Jul 27 | N/A |
| Case-Shiller Composite 20 Home Price Index YoY | Tue Jul 28 | 0.6% |
| Richmond Fed Manufacturing Index | Tue Jul 28 | 3.0 |
| Federal Reserve Interest Rate Decision/Presser | Wed Jul 29 | N/A |
| US PCE Price Index YoY | Thu Jul 30 | 3.7% |
| US Employment Cost Index YoY | Fri Jul 31 | N/A |
| US Oil Rig Count | Fri Jul 31 | N/A |
Key Interest Rates — As of 7/24/26
| Rate | As of | Latest | 1 Mo Ago | 1 Mo % | 1 Yr Ago | 1 Yr % |
|---|---|---|---|---|---|---|
| 1 Month Treasury | 7/24/26 | 3.80% | 3.66% | 3.8% | 4.37% | -13.0% |
| 2 Year Treasury | 7/24/26 | 4.33% | 4.11% | 5.4% | 3.91% | 10.7% |
| 10 Year Treasury | 7/24/26 | 4.69% | 4.41% | 6.3% | 4.43% | 5.9% |
| 30 Year Mortgage | 7/23/26 | 6.58% | 6.47% | 1.7% | 6.75% | -2.5% |
| US Corporate AAA | 7/23/26 | 5.33% | 5.05% | 5.5% | 4.85% | 9.9% |
| US Corporate BBB | 7/23/26 | 5.62% | 5.38% | 4.5% | 5.27% | 6.6% |
| US Corporate CCC | 7/23/26 | 14.25% | 13.80% | 3.3% | 12.26% | 16.2% |
| Effective Fed Funds | 7/23/26 | 3.63% | 3.63% | 0.0% | 4.33% | -16.2% |
US Economy Indicators
| Indicator | As of | Latest | 1 Mo Ago | 1 Mo % | 1 Yr Ago | 1 Yr % |
|---|---|---|---|---|---|---|
| Consumer Sentiment | 6/30/26 | 49.50 | 49.80 | -0.6% | 60.70 | -18.5% |
| Unemployment Rate | 6/30/26 | 4.20% | 4.30% | -2.3% | 4.10% | 2.4% |
| Inflation Rate | 6/30/26 | 3.50% | 3.80% | -7.9% | 2.70% | 29.6% |
| Manufacturing PMI | 6/30/26 | 53.30 | 52.70 | 1.1% | 49.00 | 8.8% |
| Non Manufacturing PMI | 6/30/26 | 54.00 | 53.60 | 0.7% | 50.80 | 6.3% |
| Retail Sales | 6/30/26 | 666,056 | 657,830 | 1.3% | 621,374 | 7.2% |
| Building Permits | 6/30/26 | 1,367 | 1,423 | -3.9% | 1,399 | -2.3% |
Suggested Readings
Leadership Insight
“And as you've seen, while we have increased our capacity quite significantly over the past 3 years, the demand still outpaces that investment. And we are, just like the rest of the industry, working in a supply-constrained environment. So we're working hard to do that. We do have a benefit of having the full stack approach. So we're able to drive operational efficiencies, technological efficiencies within our technical infrastructure organization so that we can deliver more compute. But as long as we see these attractive opportunity to invest, we will continue to invest.”
Stocks to Watch
For our full list of Stocks To Watch, contact Patrick Mullin at pmullin@timberpointcapital.com
U.S. equities finished lower as concerns about the costs and prospective returns of heavy AI investment, higher oil prices, and rising Treasury yields outweighed generally strong early 2Q26 earnings. The Nasdaq declined 2.1%, the SPX fell 0.6%, the DJIA lost 0.4%, and the R2K slipped 1.1%. Consumer Discretionary (XLY) and Communication Services (XLC) were the weakest sectors, down 5.2% and 3.9%, respectively, while Energy (XLE) gained 3.3%. Utilities, Industrials, Real Estate, Materials, and Health Care also advanced, while Technology was slightly better than flat. Value stocks across the market cap spectrum outperformed growth stocks. GOOGL reported strong results, including 82% y/y cloud revenue growth, but raised 2026 capital-spending guidance to $195-$205B and indicated that 2027 spending would rise significantly. Investors were spooked by the reported negative quarterly free cash flow of $5.9B, its first negative quarter since becoming public, and unimpressed by the latest Gemini model release. TSLA declined by ~15% as it disclosed its first cash burn in two years and forecast larger future outlays which unsettled investors. Economic data remained resilient as the S&P Global Services PMI rose to 53.6 in July from 51.2, lifting the Composite PMI to an eight-month high, while manufacturing moderated slightly to 53.8. Initial jobless claims fell to 187K, the lowest reading since 1969, and continuing claims edged down to 1.796M. New-home sales increased 1.6% m/m to an annualized 628K, although they remained 5.6% below year-ago levels and the median sales price declined to $398,300. Treasury prices declined as higher oil prices renewed inflation concerns and increased expectations for additional Fed tightening. Two-year yields rose about 10 basis points to 4.31% and 10-year yields increased roughly 17 basis points to 4.71%, the highest 10-year level since Jan '25. Oil gained 8.6% for the week despite a Friday pullback on possible new negotiations, while gold rose 0.8%, silver gained 4.0%, and natural gas fell 1.1%.
| Asset Class | 1 Wk | 1 Mo | 3 Mo | YTD | 1 Yr | 3 Yr | 5 Yr |
|---|---|---|---|---|---|---|---|
| S&P 500 | -0.60% | 0.81% | 3.74% | 8.99% | 17.88% | 19.21% | 12.54% |
| Dow Jones Industrials Average | -0.38% | 0.26% | 5.94% | 9.05% | 18.16% | 15.70% | 10.26% |
| NASDAQ | -2.13% | -1.95% | 0.71% | 7.80% | 19.33% | 21.95% | 11.79% |
| S&P MidCap 400 | 0.23% | -0.03% | 4.25% | 15.29% | 20.28% | 13.49% | 8.87% |
| Russell 2000 | -1.09% | -1.81% | 5.43% | 18.79% | 31.71% | 15.80% | 7.26% |
| Russell Micro Cap | -2.24% | -2.49% | 4.36% | 19.33% | 39.73% | 20.04% | 6.93% |
| Sector | 1Wk | YTD |
|---|---|---|
| -5.22% | -8.01% | |
| 0.09% | 3.70% | |
| 1.44% | 13.95% | |
| 1.17% | 15.63% |
| Sector | 1Wk | YTD |
|---|---|---|
| -3.93% | -9.17% | |
| 3.36% | 35.17% | |
| 1.81% | 18.37% | |
| 0.17% | 22.46% |
| Sector | 1Wk | YTD |
|---|---|---|
| -1.24% | 9.67% | |
| 0.92% | 5.91% | |
| 2.48% | 9.88% |
| Style | 1 Wk | 1 Mo | 3 Mo | YTD | 1 Yr | 3 Yr | 5 Yr |
|---|---|---|---|---|---|---|---|
| Large Growth | -2.12% | -0.27% | 0.39% | 2.91% | 11.30% | 20.93% | 11.47% |
| Large Blend | -0.64% | 0.76% | 3.79% | 8.61% | 17.44% | 19.34% | 12.05% |
| Large Value | 1.43% | 2.09% | 9.16% | 16.98% | 25.53% | 17.19% | 12.52% |
| Mid Growth | -0.43% | -2.93% | 3.31% | 5.04% | 1.23% | 12.33% | 4.66% |
| Mid Blend | 0.38% | 0.88% | 5.32% | 11.83% | 13.71% | 14.12% | 7.77% |
| Mid Value | 0.97% | 3.83% | 6.79% | 16.70% | 23.37% | 15.02% | 10.40% |
| Small Growth | -0.91% | -3.58% | 1.92% | 13.34% | 20.33% | 13.90% | 4.23% |
| Small Blend | -0.35% | -0.36% | 4.41% | 15.21% | 22.01% | 14.39% | 7.58% |
| Small Value | 0.04% | 2.05% | 6.21% | 16.52% | 23.14% | 14.68% | 9.97% |
A positive backdrop for the week as yet another attempt at peace takes place in the Middle East this morning as the US and Iran agree to halt strikes which causes oil prices to drop into the mid $80 range. Whether this extends to the Houthi forces in Yemen that have recently claimed attacks on Saudi ports remains to be seen.
Back home, we have a very busy week on tap with FOMC activity (Wed), PCE inflation data (Thur), and mega-cap technology earnings (AAPL, AMZN, META, MSFT) that likely continue to highlight the large capital dollars being thrown at AI initiatives. Following GOOGL's negative market reaction, investors will be focused less on revenue beats than capital-spending plans, free-cash-flow trends and evidence that AI investment is producing measurable ROI with the entire AI infrastructure eco-system in the crosshairs of negative sentiment. Also adding to the AI mosaic will be earnings from ARM, LRCX, QCOM and STX. Outside technology, results from V, MA, PYPL, SBUX and CMG will offer insight into consumer spending, credit conditions and discretionary demand.
The FOMC meets Tuesday and Wednesday, with its policy statement due Wednesday afternoon. The Fed likely leaves rates unchanged with investors focused on Chair Kevin Warsh's assessment of higher oil prices, economic activity and the potential inflationary effects of the AI infrastructure boom. A hawkish tone from the FOMC could place further upward pressure on Treasury yields and weigh on growth-stock valuations. Thursday brings the release of personal income, consumer spending and the Fed's preferred PCE inflation measures. The combination should provide a clearer picture of how resilient the consumer remains in the wake of higher oil/gasoline prices and whether inflation is spreading beyond the energy complex. Elevated inflation, along with still strong economic growth, would reinforce the higher-for-longer rate narrative, while softer data could provide some relief to bonds and rate-sensitive equities. Friday's employment cost index will put a spotlight on wage and benefit increases in both the private and public sector with employment cost growth currently running at 3.4%.
| Company | Date | EPS Est. |
|---|---|---|
| F5, Inc. (FFIV) | Mon Jul 27 | $4.14 |
| The Boeing Co. (BA) | Tue Jul 28 | ($0.11) |
| Hilton Worldwide Holdings, Inc. (HLT) | Tue Jul 28 | $2.43 |
| KLA Corp. (KLAC) | Tue Jul 28 | $1.13 |
| General Dynamics Corp. (GD) | Wed Jul 29 | $4.07 |
| Microsoft Corp. (MSFT) | Wed Jul 29 | $4.61 |
| Meta Platforms, Inc. (META) | Wed Jul 29 | $7.36 |
| Starbucks Corp. (SBUX) | Wed Jul 29 | $0.68 |
| Bristol Myers Squibb Co. (BMY) | Thu Jul 30 | $1.61 |
| Mastercard, Inc. (MA) | Thu Jul 30 | $5.11 |
| Amazon.com, Inc. (AMZN) | Thu Jul 30 | $1.90 |
| Apple, Inc. (AAPL) | Thu Jul 30 | $2.01 |
| Reddit, Inc. (RDDT) | Thu Jul 30 | $1.77 |
| AbbVie, Inc. (ABBV) | Fri Jul 31 | $3.84 |
| Chevron Corp. (CVX) | Fri Jul 31 | $4.26 |
| Exxon Mobil Corp. (XOM) | Fri Jul 31 | $3.34 |
| Data Release | Date | Est. |
|---|---|---|
| US Durable Goods Shipments YoY | Mon Jul 27 | N/A |
| Case-Shiller Composite 20 Home Price Index YoY | Tue Jul 28 | 0.6% |
| Richmond Fed Manufacturing Index | Tue Jul 28 | 3.0 |
| Federal Reserve Interest Rate Decision/Presser | Wed Jul 29 | N/A |
| US PCE Price Index YoY | Thu Jul 30 | 3.7% |
| US Employment Cost Index YoY | Fri Jul 31 | N/A |
| US Oil Rig Count | Fri Jul 31 | N/A |
International equity markets gained despite ongoing angst about the Middle East and higher oil prices. In Europe, the STOXX Europe 600 gained 0.5%, Germany's DAX rose 1.1%, France's CAC 40 advanced 0.4% and the UK's FTSE 100 gained 1.3% fueled by positive corporate earnings and improving business activity. The Eurozone manufacturing PMI increased to 52.0 and services returned to expansion at 51.6, resulting in a Composite PMI (51.5) that was the highest since Feb '26. The ECB left rates unchanged but kept the door open to further tightening. Japan's Nikkei 225 gained 0.7%, while the broader TOPIX advanced 2.4%. Financial shares benefited from rising JGB yields and expectations for additional BoJ tightening, while technology and semiconductor shares were volatile. The 10-year JGB yield rose to 2.80% from 2.70%, while the yen weakened toward JPY 164 per USD, near a 40-year low. Higher oil prices, continued yen weakness, and U.S. tariff developments all weighed on sentiment despite index increases. Mainland Chinese equities advanced led by the CSI 300 rise of 2.7% and the Shanghai Composite's gain of 1.3%, supported by state-backed purchases and renewed interest in domestic AI and semiconductor shares. State-owned capital platforms disclosed nearly RMB 60B of equity purchases, major insurers announced plans to raise long-term equity allocations, and the PBoC supplied additional medium-term liquidity. The measures suggested targeted market support rather than a broad new stimulus program. Hong Kong's Hang Seng gained 1.6% on strength in technology-related shares despite Friday's regional risk-off move.
| Region | 1 Wk | 1 Mo | 3 Mo | YTD | 1 Yr | 3 Yr | 5 Yr |
|---|---|---|---|---|---|---|---|
| MSCI ACWI | -0.29% | 0.21% | 3.59% | 10.08% | 19.44% | 18.73% | 10.96% |
| MSCI ACWI ex USA | 0.38% | -0.92% | 3.02% | 11.86% | 22.27% | 17.24% | 8.73% |
| MSCI Emerging Markets | 0.48% | -5.67% | 1.79% | 17.27% | 30.82% | 19.70% | 6.98% |
| MSCI Europe Stock | -0.04% | 1.80% | 3.71% | 7.58% | 16.02% | 15.20% | 9.24% |
| MSCI Asia Pacific Stock | 0.82% | -4.05% | 3.54% | 16.87% | 27.19% | 19.02% | 7.96% |
| MSCI Latin America Stock | 1.36% | 4.78% | -5.47% | 13.60% | 39.43% | 11.65% | 10.26% |
| Rate | Latest | 1 Mo Ago | 1 Mo % | 1 Yr Ago | 1 Yr % |
|---|---|---|---|---|---|
| 1 Month Treasury | 3.80% | 3.66% | 3.8% | 4.37% | -13.0% |
| 2 Year Treasury | 4.33% | 4.11% | 5.4% | 3.91% | 10.7% |
| 10 Year Treasury | 4.69% | 4.41% | 6.3% | 4.43% | 5.9% |
| 30 Year Mortgage | 6.58% | 6.47% | 1.7% | 6.75% | -2.5% |
| US Corporate AAA | 5.33% | 5.05% | 5.5% | 4.85% | 9.9% |
| US Corporate BBB | 5.62% | 5.38% | 4.5% | 5.27% | 6.6% |
| US Corporate CCC | 14.25% | 13.80% | 3.3% | 12.26% | 16.2% |
| Effective Fed Funds | 3.63% | 3.63% | 0.0% | 4.33% | -16.2% |
| Indicator | Latest | 1 Mo Ago | 1 Mo % | 1 Yr Ago | 1 Yr % |
|---|---|---|---|---|---|
| Consumer Sentiment | 49.50 | 49.80 | -0.6% | 60.70 | -18.5% |
| Unemployment Rate | 4.20% | 4.30% | -2.3% | 4.10% | 2.4% |
| Inflation Rate | 3.50% | 3.80% | -7.9% | 2.70% | 29.6% |
| Manufacturing PMI | 53.30 | 52.70 | 1.1% | 49.00 | 8.8% |
| Non Manufacturing PMI | 54.00 | 53.60 | 0.7% | 50.80 | 6.3% |
| Retail Sales | 666,056 | 657,830 | 1.3% | 621,374 | 7.2% |
| Building Permits | 1,367 | 1,423 | -3.9% | 1,399 | -2.3% |
RNG has been in a multi-year basing period and most recently has been putting in higher lows. Last week's big move on heavy volume pushed the stock through intermediate resistance levels and it is now contending with limited near term resistance. We believe the stage is set for a meaningful move higher in the near future.
“And as you've seen, while we have increased our capacity quite significantly over the past 3 years, the demand still outpaces that investment. And we are, just like the rest of the industry, working in a supply-constrained environment. So we're working hard to do that. We do have a benefit of having the full stack approach. So we're able to drive operational efficiencies, technological efficiencies within our technical infrastructure organization so that we can deliver more compute. But as long as we see these attractive opportunity to invest, we will continue to invest.”
For our full list of Stocks To Watch, contact Patrick Mullin at pmullin@timberpointcapital.com
©2020 YCharts, Inc. All Rights Reserved. YCharts, Inc. ("YCharts") is not registered with the U.S. Securities and Exchange Commission as an investment adviser, broker-dealer or in any other capacity, and does not purport to provide investment advice or make investment recommendations. This report has been generated through application of the analytical tools and data provided through ycharts.com and is intended solely to assist you or your investment or other adviser(s) in conducting investment research.
All data, statistics and charts are courtesy of YCharts unless otherwise noted. Investment Advice is offered through Fortis Capital Advisors, LLC, 7301 Mission Road, Suite 326, Prairie Village, KS 66208.
While reasonable efforts were used to obtain information from sources believed to be reliable, Fortis Capital Advisors, LLC makes no representation that the information or opinions contained in this material are accurate, reliable, or complete. All information and opinions are subject to change without notice. You should not construe this report as an offer to buy or sell, as a solicitation of an offer to buy or sell, or as a recommendation to buy, sell, hold or trade, any security or other financial instrument.
Past performance is not indicative of future results. Investing involves risk, including the possible loss of principal. The information contained herein is provided for informational purposes only and should not be construed as investment, tax, or legal advice. Recipients should consult their own advisers before making any investment decisions.
Source: Timber Point Capital Management. Powered by Fortis Capital Advisors. Investment Advice is offered through Fortis Capital Advisors, LLC, 7301 Mission Road, Suite 326, Prairie Village, KS 66208. All rights reserved.