A very successful competitor asset manager in Boston famously produces a periodic report where they forecast expected real returns of various asset classes for the subsequent seven years. This report is often cited in the financial press and is held by many to be the standard of prudent long term thinking about opportunities across various investments and where wise, forward looking investors should allocate their monies. Unique asset classes are very often favored while run of the mill asset classes, such as US large cap stocks and bonds, are typically viewed as unattractive.
Before we get to the punch line, I’d like to stress that although this may come off as a criticism, it is not. Forecasting anything is hard. Ask an epidemiologist. Forecasting investment returns is particularly difficult and is subject to the criticism of clients as well as run of the mill spectators (like me). I give this asset management company credit for continuing to embark on this task, as thankless as it may be.

As you can see from the above data, the forecast made seven years ago proved not to be very prescient as the spread between anticipated and realized returns is very wide, particularly among US large cap equities. The predicted financial market repression and new normal of the US economy did not materialize and the expected rotation from “overvalued” US equities to international and alternative investments never occurred. In fact, the US economy proved to be exceptional within the global community for its dynamism and ability to grow and profit. By comparison, emerging markets continued to be mired in governance and policy messes while Europe and Japan suffered with poor demographics and economic policies designed for stagnation. The US really was the only game around and the relative returns proved that.
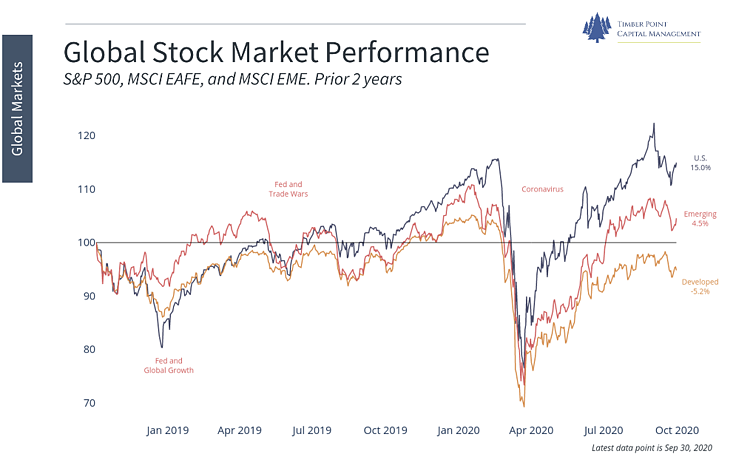
And so, it continued over this past quarter, despite the ongoing concerns over COVID-19. The US equity market continued to post strong returns and outperform most other asset classes, with very few exceptions. From its bottom in March, the S&P 500 has risen 31%, Emerging Markets are up 30% and EAFE is up 21%. Robust international returns indeed, but again, the US led the pack as it has for the past two years as seen below.

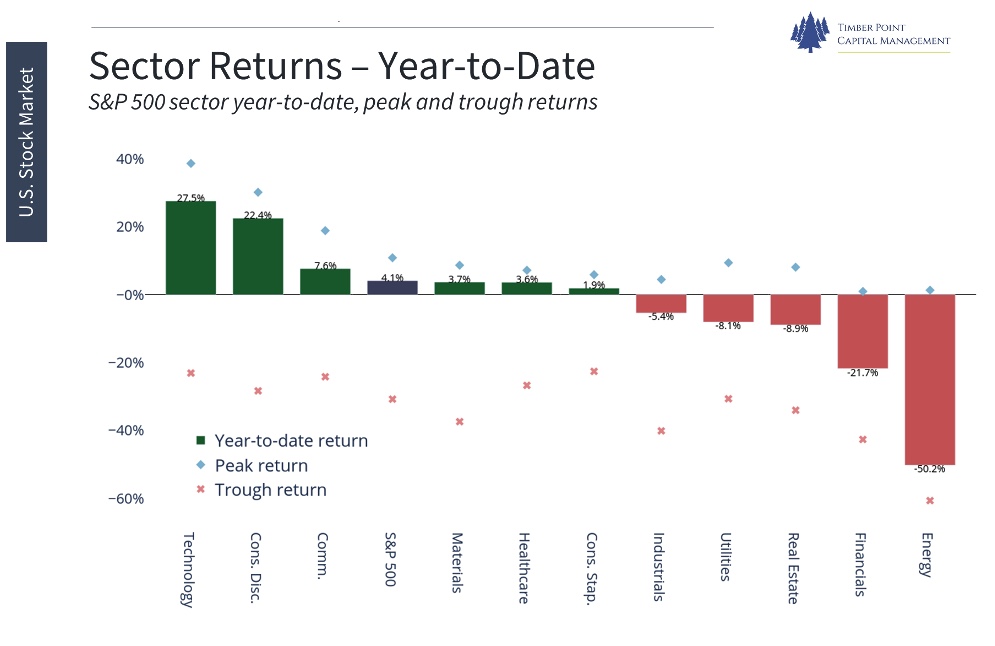
Yet, the return of the S&P 500 on an index basis does not fully reflect the changes going on within the economy and by extension within the components of the index. Most of us are aware of the outperformance of the technology sector and its role as a leadership asset class, particularly today as technological solutions sit in the middle of the new de-centralized workplace environment that will likely exist in a post COVID-19 world. We have long been believers in the technology sector as the most dynamic and important sector in the US economy and have appropriately over weighted the sector.

Yet, beyond acknowledging the outperformance of US large cap and technology stocks one needs to peel back the onion a bit and look at the evolution of the constituents of the S&P 500 and question if we are now reaching extremes. Keeping with the seven year window of comparison, take a look below at the market cap breakout both by a sector and top company basis.

As you can see, technology has grown sharply in the overall importance of the S&P 500 and the beleaguered energy sector has dropped to the point of relative insignificance, now representing only 2.5% of the index!
Changes to the top constituents in the S&P 500 over the past seven years have also been pronounced.

Today, the top 5 holdings of the S&P 500 represent almost 25% of the total market value and are made up exclusively of technology companies. We have not seen this level of concentration in the US equity market since the tech bubble of 1999 when the top 5 companies made up nearly 19% of the index, and by the way, the subsequent seven years saw a meaningful rotation away from large cap into small cap, international stocks and alternative asset classes. And it is not just S&P 500 market cap distribution which has reached extremes. Growth versus value, large versus small, international versus US have all reached extremes in relative market performance and market representation. Possibly this outlier scenario is among the reasons why the recent market pullback in technology companies proved to be so sharp.

Importantly, these data points alone would not be a catalyst for us to change our investment allocations but we do believe they must be considered as we make our forecasts and investment changes as we enter the fourth quarter. Our long time economic advisor, Victor Canto often counsels us that valuations and market capitalization reflect the fundamentals and as long as the fundamental factors remain the same so should the return patterns. As such, we continue to evaluate our key economic and market variables in order to determine if the environment remains attractive for risk takers and where the risks should be taken.
2020 4Q Key Economic and Investment Drivers
| Real Economic Growth | Rising
Stable Falling |
The shock of COVID-19 and the subsequent shutdown have been devastating to the US economy. As normalization occurs the economy should recover sharply from today’s depressed levels. Dramatic fiscal and monetary stimulus should provide meaningful help, but secondary effects of the shutdown will have an impact. |
| Inflation | Rising
Stable Falling |
Given the collapse of demand across the economic spectrum, inflationary pressures have remained muted. Supply disruptions may occur across pockets of the economy as “opening for business” will not be an instantaneous process. |
| Real Interest Rates | Rising
Stable Falling |
The Federal Reserve has been proactive in dealing with COVID-19 by initiating a wide range of stimulus measures, including a resumption of quantitative easing. Longer term interest rates remain low but are now reflecting an improved growth outlook. |
| US Dollar F/X Value | Rising
Stable Falling |
The dollar has fallen sharply from highs as the interest rate differentials between US rates and international rates have narrowed sharply. The US bond market is not as nearly as attractive a resting spot for global capital. |
| Taxes and Regulations | Rising
Stable Falling |
The fiscal response to COVID-19 has been meaningful with over $2 trillion of aid being injected in the economy and possibly more on the way. As a result of COVID-19, government intervention in the economy has been significant and rising. The pending election will clearly impact future policy direction. |
| P/E Ratios | Rising
Stable Falling |
As with the broader economy, earnings have troughed and are now showing signs of improvement. It is unlikely that S&P 500 earnings get back to their 2019 peak, however. Valuation metrics remain high. |
| Fixed Income Risk Premiums | Rising
Stable Falling |
Supported by Fed policy, broad credit spreads have fallen sharply upon the re-opening of the economy. Security specific risks will remain across credit investments as defaults will be inevitable among weak players in stressed industries. |
| Volatility | Rising
Stable Falling |
Volatility which spiked to near record levels at the depths of the COVID crisis, has fallen as the crisis has subsided and the economy has improved. Pockets of increased volatility are likely, particularly going into the election. |
Bullish Neutral Bearish
As you can see from our key economic and investment drivers, our overall fundamental viewpoint is mixed with both bullish and bearish indicators going into the fourth quarter. Economic growth remains an important bullish variable as we do believe that the economy continues to rebound from its COVID-19 driven spring shutdown. Yet there are some meaningful changes in our indicators, which lead us to believe that risks may be increasing and the long-anticipated rotation away from US large cap and technology stocks may be afoot.
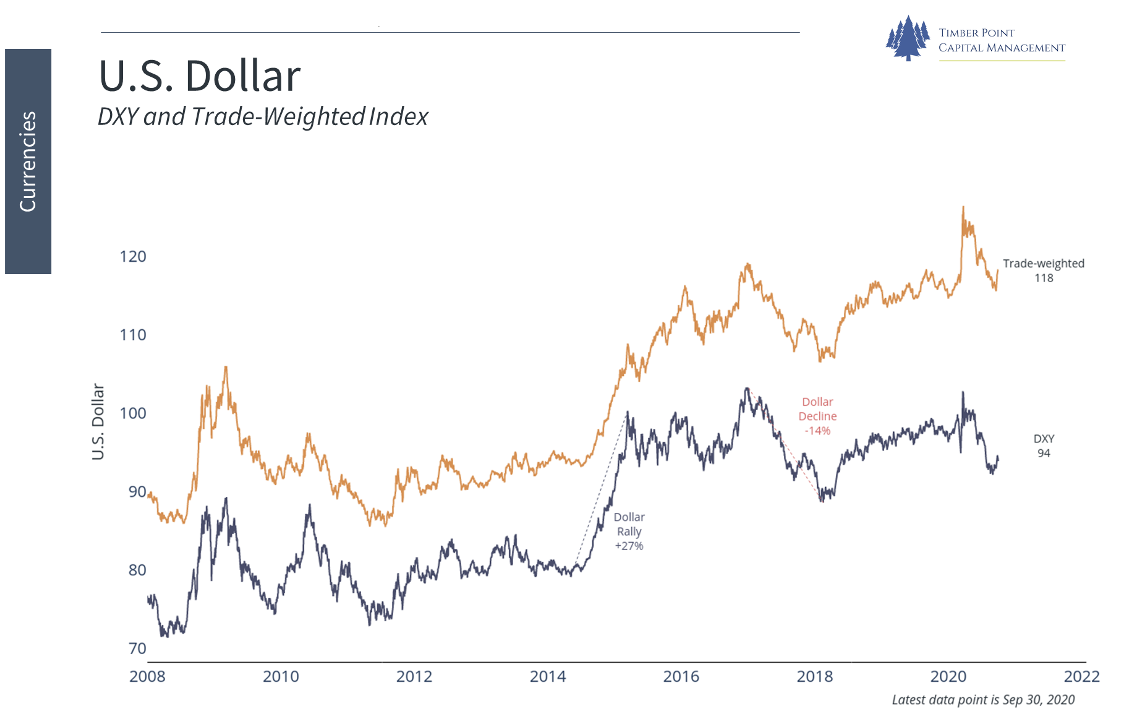
Firstly, we have begun to see a sell off in the dollar. Since the financial crisis of 2008, the dollar has been the heavyweight currency in global capital markets as both economic growth and interest rates have been much higher in the US than overseas. A year ago, government interest rates in Europe and Japan were negative and the US was a high yielder with 3% long term Treasury yields. Correspondingly, global capital gravitated to those high yields. Now that the Federal Reserve has embarked on further, extremely aggressive quantitative easing, those interest rate differentials have narrowed thus reducing the bid for the dollar and dollar based investments. Although that is not entirely a bearish indicator, it is another factor that may be telling us that foreign markets may have a currency tailwind at their backs.

Another variable which is flashing red is our tax and regulation indicator. We do believe that government policy can have a meaningful impact on the economy and this indicator is a gauge, determining if government activity in the private economy is helpful or hurtful. It is clear to us that the intervention of government on the private sector is now at extremely high levels due to COVID-19 and the net effect on the economy has been negative. Yes, there has been an extraordinary fiscal stimulus in the form of $2 trillion in aid to taxpayers, small businesses and corporations in the form of direct cash outlays, payroll protections and low interest loans. And yes, that stimulus has provided temporary relief. Yet, it has been the ever-changing COVID-19 regulations, particularly at the state level, which have had an extraordinary negative impact on business, particularly small businesses. In as much as we believe that the economy is in the process of re-opening, government micromanagement will likely elongate the prudent time to re-open. Most importantly, this intervention is unlikely to recede even as COVID-19 diminishes as an ongoing health issue. Interventionist government appears to be here to stay.
Lastly, we have an election in a month and possibly the market selloff in September is an indication of an increasing risk aversion among investors as the last month of electioneering will be contentious and the outcome remains uncertain. In fact, the volatility curve exhibits a big kink in November, clearly indicating expected market turbulence around the election and possibly thereafter. We will be back to you in a few weeks to further discuss potential policy impacts as the election results become clearer.

Given this more worrisome outlook, our investment allocations are skewed more defensively for the fourth quarter. We continue to believe that the economy is undergoing a re-opening and that Federal Reserve policy remains accommodative and supportive of risk assets, yet these new bearish fundamental variables argue for us to reduce our previous overweight to risk assets and move to a more neutral position. As much as anything we believe the changing fundamentals argue for a rotation away from what has previously worked best. Our portfolios will have reduced exposure in the tech heavy S&P 500 and will reallocate to high grade bonds, smaller cap equities and some international markets. We will retain a large allocation to alternatives as a less concentrated market environment should benefit actively managed strategies.
As mentioned above, forecasts are difficult, and like our above mentioned competitor, we subject ourselves to the risk of getting it wrong. Yet, there appears to be a fundamental change going on across the economy and financial markets which lead us to strongly believe that the time may be right to alter portfolios away from what has worked so well for so long.
IMPORTANT DISCLOSURES
The information in this report was prepared by Timber Point Capital Management, LLC. Opinions represent TPCM’s and IPI’s opinion as of the date of this report and are for general information purposes only and are not intended to predict or guarantee the future performance of any individual security, market sector or the markets generally. IPI does not undertake to advise you of any change in its opinions or the information contained in this report. The information contained herein constitutes general information and is not directed to, designed for, or individually tailored to, any particular investor or potential investor.
This report is not intended to be a client-specific suitability analysis or recommendation, an offer to participate in any investment, or a recommendation to buy, hold or sell securities. Do not use this report as the sole basis for investment decisions. Do not select an asset class or investment product based on performance alone. Consider all relevant information, including your existing portfolio, investment objectives, risk tolerance, liquidity needs and investment time horizon.
This communication is provided for informational purposes only and is not an offer, recommendation, or solicitation to buy or sell any security or other investment. This communication does not constitute, nor should it be regarded as, investment research or a research report, a securities or investment recommendation, nor does it provide information reasonably sufficient upon which to base an investment decision. Additional analysis of your or your client’s specific parameters would be required to make an investment decision. This communication is not based on the investment objectives, strategies, goals, financial circumstances, needs or risk tolerance of any client or portfolio and is not presented as suitable to any other particular client or portfolio. Securities and investment advice offered through Investment Planners, Inc. (Member FINRA/SIPC) and IPI Wealth Management, Inc., 226 W. Eldorado Street, Decatur, IL 62522. 217-425-6340.


Recent Comments