The Timber Log is a quick overview of Timber Point Capital’s most recent investment thoughts. If you have questions about the content, please reach out to Patrick Mullin. The information contained herein does not constitute investment advice or a recommendation for you to purchase or sell any specific security.
And there you have it…the air comes out of the Inflation balloon…
- CPI print on Tuesday confirms what we already suspected – inflation is exiting the system…and doing so at an accelerating rate…lowest All Items m/m print since July 2022…
- All items CPI unchanged (that is…0.0%) in Oct vs. September…Y/Y figure of 3.2% compares to September’s 3.7% figure, largely led by declines in energy prices
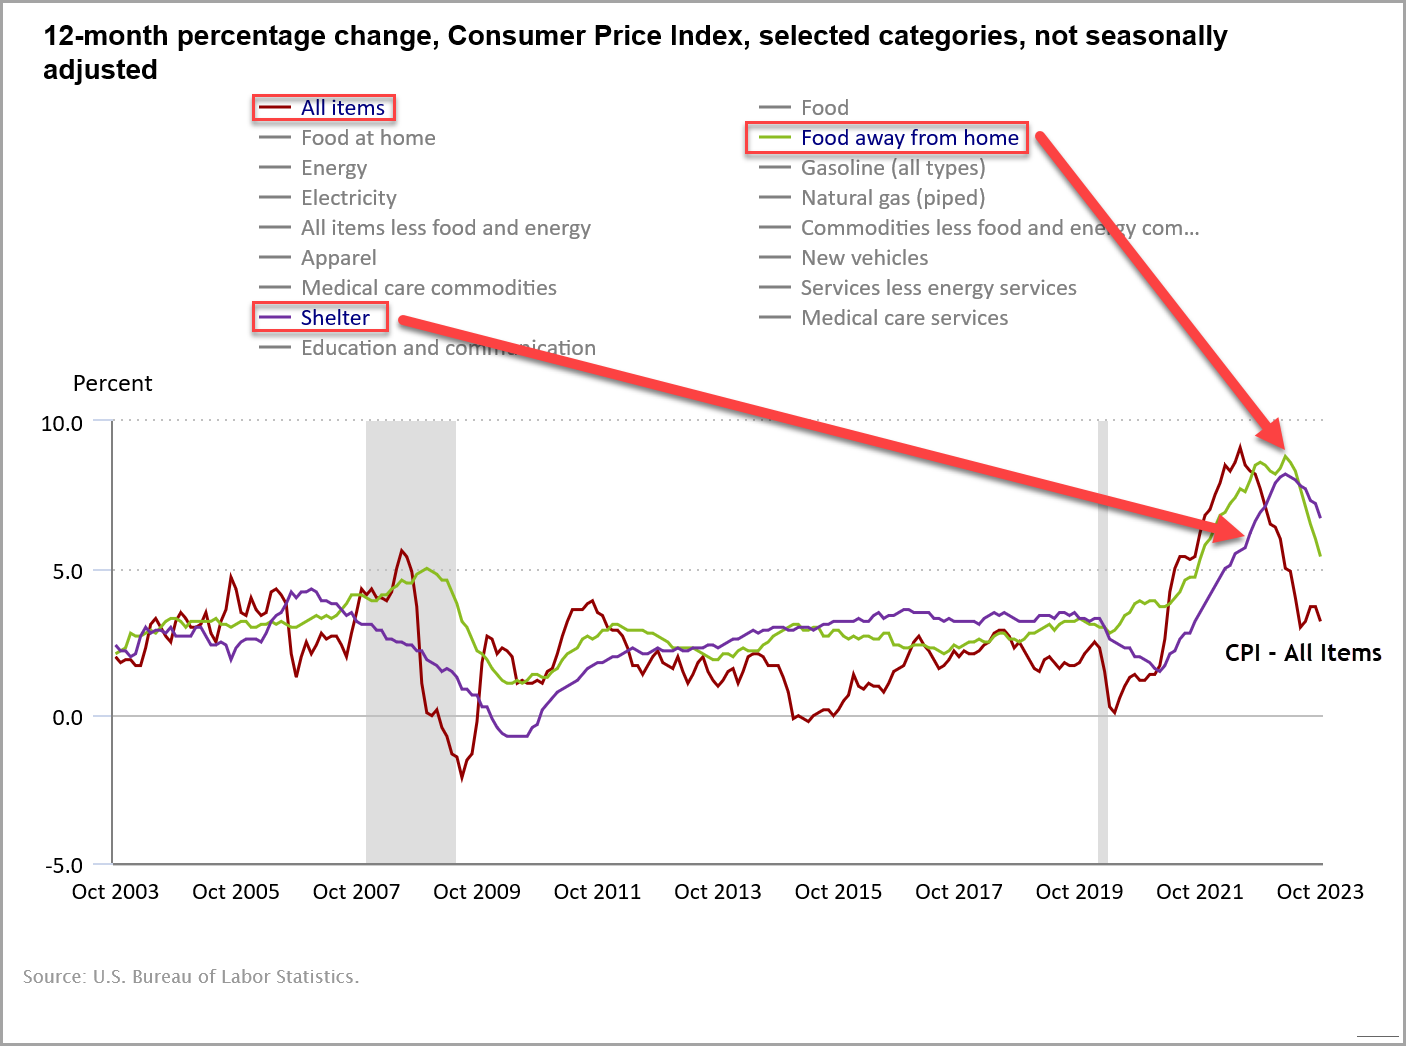
- Core CPI, ex food and energy, was up .2% m/m and 4.0% y/y…Shelter (~ 33% of index) is up 6.7% y/y and Food Away from Home (~ 5% of index) is up 5.4% y/y…(see chart)
- Expect Shelter to continue to decline…Rent is 7% of CPI and Zillow Rent Index continues to decline…OER is 25% of CPI with average price for New Houses down 10% since end ’22…
- The Fed won’t move its 2% goal posts…but after perky m/m prints in August and September, returning to flat to 0.2% m/m is consistent with a 2% inflation target
- Tamer inflation prints do not mean that all is fine…the general price level is most certainly higher vs. two years ago…for example, prices for new houses have increased by 25% since mid ’21…food away from home by 15%…
- This can wear on consumers and is likely a large reason for the punk Michigan consumer sentiment reading (page 1)…past accelerations in inflation have coincided with poor sentiment
- Advocates for the Phillips Curve are confused…how can GDP prints continue strong while inflation subsides?
- We believe the answer is in the money supply…M2 Y/Y growth has been declining since the end of ’21 and negative since December ’22…when lagged vs. CPI by 16 months (page 2), there is a very strong correlation…
- The Fed’s balance sheet continues to contract by ~ $90B/month…total assets held by the Fed are now under $8T, down from a peak of slightly over $9T…pre pandemic total assets were $4T-ish
- Our thinking has been that inflation recedes gradually yet consistently…this latest report suggests we may be conservative in our assessment and are likely near the Fed’s 2% target

And on the employment front…will October be a precursor going forward?
- A bit of old news here but data that was greeted with a 1% move in the SPX on 11/3…and bears watching going forward…
- Nonfarm employment increased by 150K in October, shy of estimates of 170K…
- Perhaps this was a function of ~ 33K striking auto workers at F, GM and STLA which led to an overall 35K decline in the manufacturing sector figure…
- But importantly, August and September were revised down by a cumulative 100K, not an insignificant number, to 165K (-62K) and 297K (-40K), respectively
- The monthly employment gain has averaged 258K over the prior 12 months…so 2 of the past 3 months reflect quite a slowdown in the Establishment survey…
- Granted, this is relative to the 100K level that economists commonly believe is needed to exceed population growth
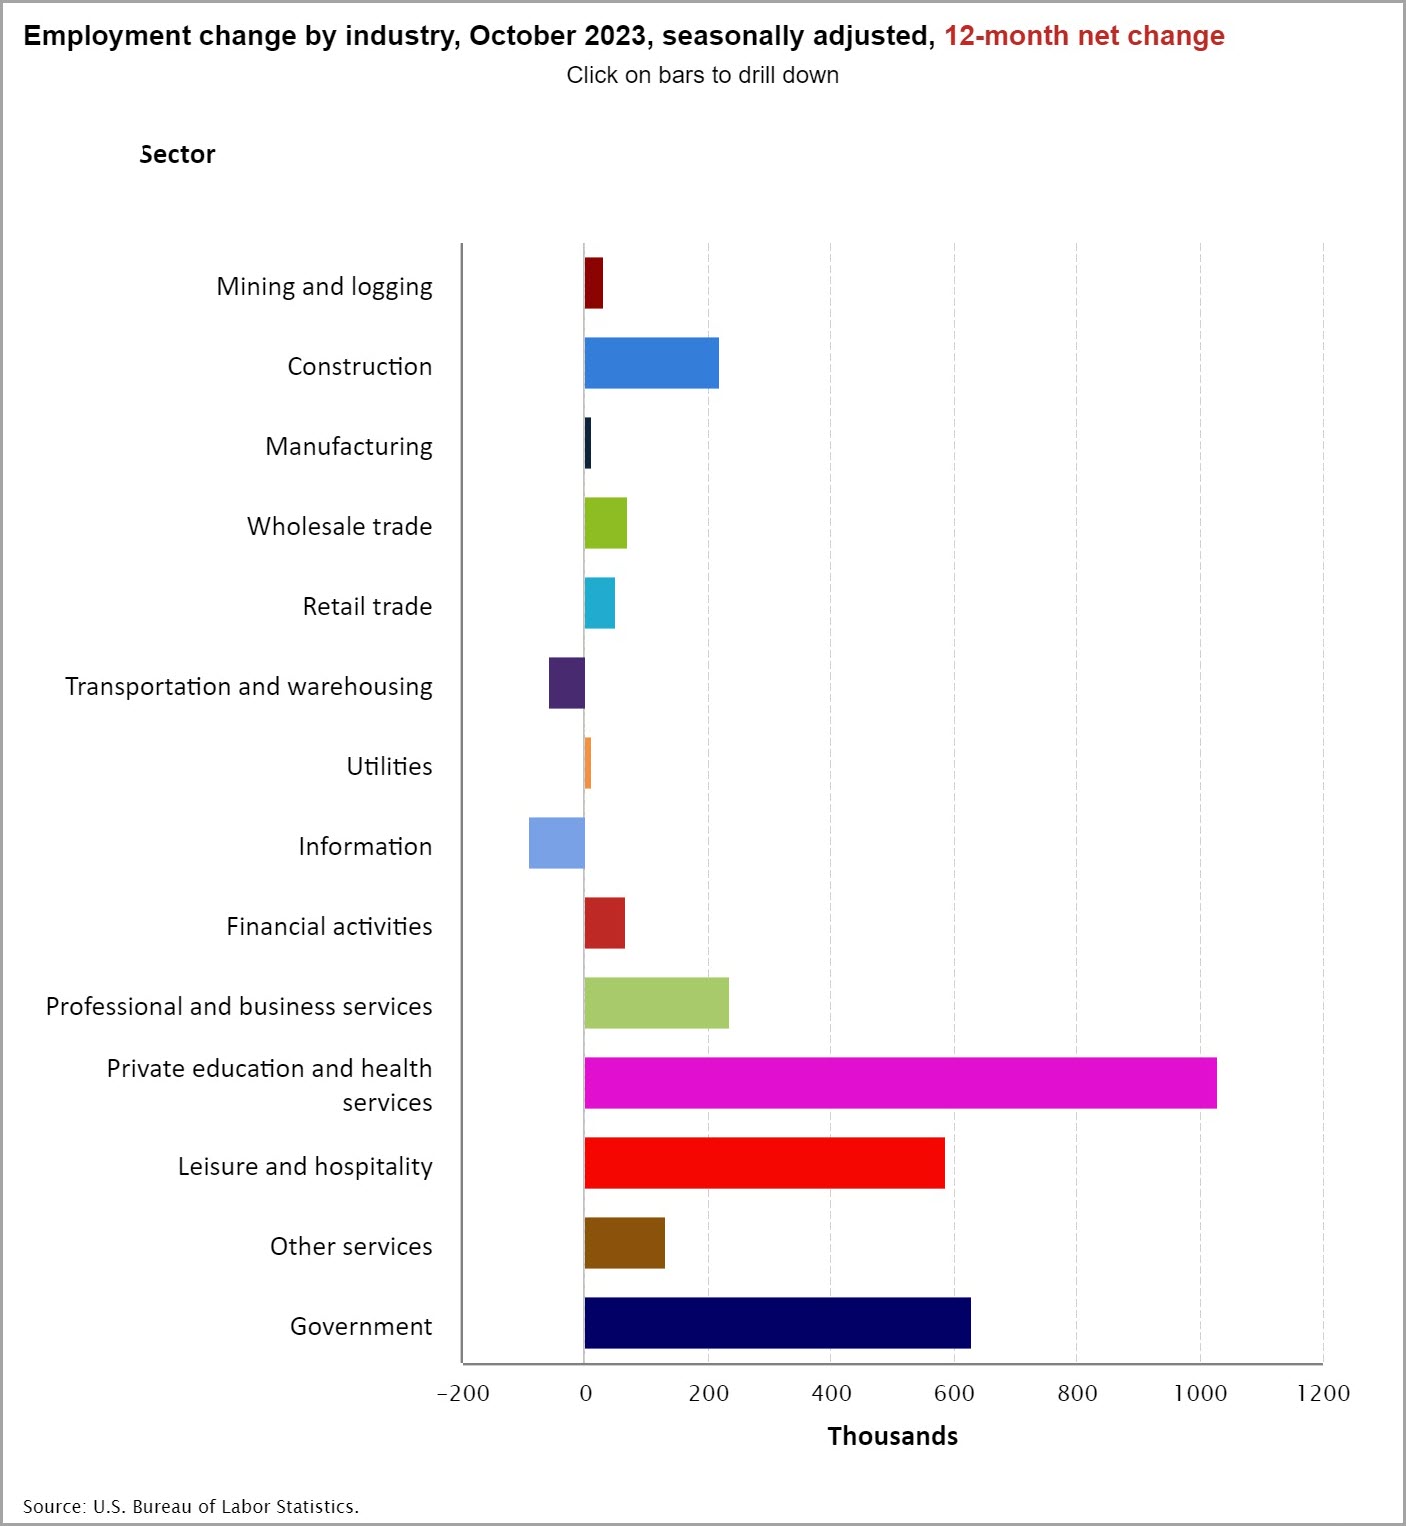
- As the chart above shows, job gains over the past twelve months have been focused in the Private Education & Healthcare Services, Government and Leisure/Hospitality sectors…with a minor callout to Construction and Professional/Business Services
- Within Private Education & Healthcare Services, Healthcare has added over 600K jobs, with over half of that in the Ambulatory sector…a function of evergreen growth in healthcare spending?
- The Government sector has largely been a function of local government hiring, almost 2/3 of the total…
- As for Leisure/Hospitality, this is largely a function of Food Services/Drinking places…a continued hiring recovery from the pandemic…
- Since the pandemic, total nonfarm payrolls have expanded by ~ 4.4M workers, with ~ 4.5M of those workers coming from the private side…
- Total Government employment only matches pre pandemic levels – somewhat surprising…although federal gains are offset by losses at the state and local levels
- The strongest drivers of the post pandemic payrolls (page 3), are professional/business services (+1.6M), private education/healthcare (+1.3M), transportation/warehousing (+900K) and financial activities (+300K)
- Interestingly, both professional/business services and transportation/warehousing have been flat m/m for the past several months
- This implies that for employment adds to accelerate from current levels we will need new drivers to kick in within the old leaders or laggard sectors to accelerate…
- Perhaps the economy is finding a familiar balance…for the past 6 months, nonfarm payroll adds have essentially matched the average level of the 2010’s at ~ 200K employment gains per month (page 4)…
- On the wage front, despite union gains, slowing nonfarm payrolls appear to be impacting average hourly earnings (page 5) which also appear headed back to their 2010’s average in the 2% – 3% range…
- According to the JOLTS data there is little change in the dynamics of hiring…we will be on the look out for how these figures and sectors play out over the next several months…
________________________________________________________________________________________________________________________________________
IMPORTANT DISCLOSURES The information in this report was prepared by Timber Point Capital Management, LLC. Opinions represent TPCM’s and IPI’s’ opinion as of the date of this report and are for general information purposes only and are not intended to predict or guarantee the future performance of any individual security, market sector or the markets generally. IPI does not undertake to advise you of any change in its opinions or the information contained in this report. The information contained herein constitutes general information and is not directed to, designed for, or individually tailored to, any particular investor or potential investor. This report is not intended to be a client-specific suitability analysis or recommendation, an offer to participate in any investment, or a recommendation to buy, hold or sell securities. Do not use this report as the sole basis for investment decisions. Do not select an asset class or investment product based on performance alone. Consider all relevant information, including your existing portfolio, investment objectives, risk tolerance, liquidity needs and investment time horizon. This communication is provided for informational purposes only and is not an offer, recommendation, or solicitation to buy or sell any security or other investment. This communication does not constitute, nor should it be regarded as, investment research or a research report, a securities or investment recommendation, nor does it provide information reasonably sufficient upon which to base an investment decision. Additional analysis of your or your client’s specific parameters would be required to make an investment decision. This communication is not based on the investment objectives, strategies, goals, financial circumstances, needs or risk tolerance of any client or portfolio and is not presented as suitable to any other particular client or portfolio. Securities and investment advice offered through Investment Planners, Inc. (Member FINRA/SIPC) and IPI Wealth Management, Inc., 226 W. Eldorado Street, Decatur, IL 62522. 217-425-6340.[/et_pb_text][/et_pb_column]
[/et_pb_row]
[/et_pb_section]


Recent Comments