The Timber Log is a quick overview of Timber Point Capital’s most recent investment thoughts. If you have questions about the content, please reach out to Patrick Mullin. The information contained herein does not constitute investment advice or a recommendation for you to purchase or sell any specific security.

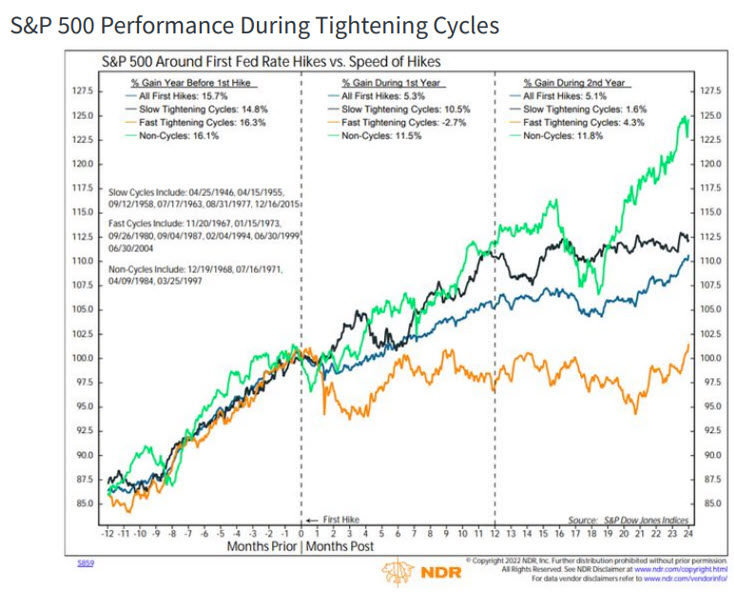
The pace of Fed hikes can impact future performance of the S&P 500…
- S&P 500 performance the year prior to a Fed rate hike is fairly consistent regardless of anticipated rate hike cycle (chart above)
- “Fast” hike cycles are periods like 1994 where the Fed tightened surprisingly and aggressively; “slow” hike cycles are more telegraphed and consistent such as the retreat from quantitative easing in 2015.
- Current Fed “dot plot” suggests that Fed tightening will approximate a “fast” rate hike cycle
- Mid-point of Fed “dot plot” suggests a fed funds rate of 1.75% at end of ’22, implying multiple hikes
- “Fast” hike cycles have seen muted S&P 500 returns when compared to “slow” hike cycles
- Worst performance period for “fast” hike cycles occurs in first 4 months post the first rate hike
- Interestingly, “fast” hike cycles include 1987 and 1999, both cycles saw market downturns
- “Fast” hike cycles result in S&P500 essentially flat over next 2 years versus “slow” with gains of 10%
Chart courtesy of Ned Davis Research


The Fed tapering…What exactly does the Fed balance sheet consist of?
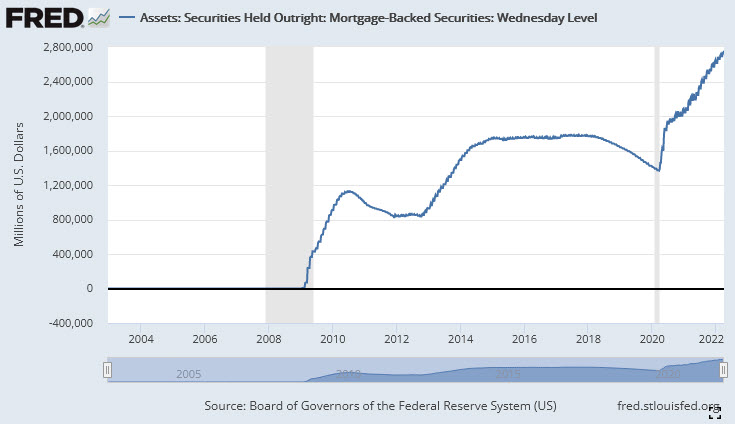
- Fed Balance Sheet holds a total of $5.7T in US Treasuries and $2.7T in mortgage-backed securities
- Treasury term schedule – up to 1 yr: $1.1T; 1-5 yr: $2.2T; 5-10 yr: $1.0T; 10+ yrs: $1.4T
- Mortgage term schedule – minimal up to 5 years; 5-10 years: $.065T; 10+ years: $2.6T
- Fed can reduce balance sheet two ways: natural “runoff” of maturities or active selling of securities (“tapering”)
- Fed has been primary buyer of U.S. Treasuries for many years…who will replace the Fed?
- Mortgage rates have been on the rise along with yields in general, 30 yr mortgage are ~ 5%
- The Fed has not been a seller of mortgage securities according to its data…
- If Fed reduces balance sheet, most impacted will be 1-5 year Treasuries, almost 40% of total holdings
- Can you spare a dollar, son? The US government last ran a budget surplus in 2001…

The Inversion Cometh…What does it mean and what does it portend?
- Yield curve inversion depends on what term structure you are looking at…duh!
- The Fed can control the short end of the yield curve, but inflation expectations control the long end
- Fed is in elongated hiking cycle so using 3-month figures in inversion analysis is misleading
- 2-year/10-year spread should accurately capture anticipated rate hikes into late ‘22/’23 as well as longer term inflation expectations
- Data back to 1980 suggests inversions (2’s/10’s) are not uncommon, occurring 7-9 times
- Following a 2/10 inversion, there is better than a 50% chance (approx. 2/3) of recession occurring
- But it’s not foolproof – both the mid ’80’s and mid ’90’s saw near inversion without a recession
- “Real” yields (adjusted for inflation) continue to be negative and stimulative for the economy
- The Fed’s response to Covid was unprecedented – dialing back inflation and avoiding recession will be a tricky scenario
- As we have said before, the opportunity for a Fed “mistake” is high in a delicate environment

Charts courtesy of Bank of America
Employment data continue to suggest that the economy is strong…
- The US economy added 431K nonfarm payroll jobs in March; Jan/Feb revised up by 95K, per BLS
- Unemployment rate of 3.6% versus 3.5% pre-pandemic level – this is a historically low level!
- Number of unemployed people dropped 318K to 6M, ~ back to pre-pandemic levels of 5.7M
- Labor force participation rate of 62.4%, below pre-pandemic level of 63.4%; but, now rising again
- Wage gains of 6.7% annualized for production and non-supervisory resemble 1970/1980 levels
- Biggest industry gainers were: leisure/hospitality, prof’l/business services and retail
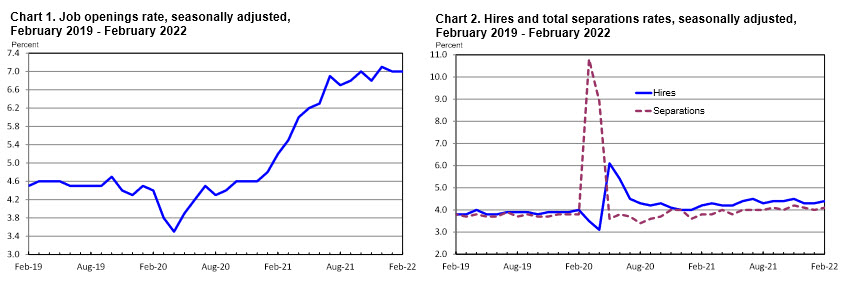
- JOLTS (Job Openings & Labor Turnover Survey, chart above) “openings” still elevated when compared to pre-pandemic levels but steady past few months
- Hires less separations = net employment gains; 6.7M less 6.1M = 600K net gain in February
- Hires strongest in construction, retail, trade/transport/utilities, prof’l/business services
- Where are the job openings? Education/health services, Prof’l/business services, leisure
- “Quits”, a reflection of worker confidence (not shown), is steady over past five months but up 20-30% over year ago levels
IMPORTANT DISCLOSURES
The information in this report was prepared by Timber Point Capital Management, LLC. Opinions represent TPCM’ and IPIS’ opinion as of the date of this report and are for general information purposes only and are not intended to predict or guarantee the future performance of any individual security, market sector or the markets generally. IPI does not undertake to advise you of any change in its opinions or the information contained in this report. The information contained herein constitutes general information and is not directed to, designed for, or individually tailored to, any particular investor or potential investor.
This report is not intended to be a client-specific suitability analysis or recommendation, an offer to participate in any investment, or a recommendation to buy, hold or sell securities. Do not use this report as the sole basis for investment decisions. Do not select an asset class or investment product based on performance alone. Consider all relevant information, including your existing portfolio, investment objectives, risk tolerance, liquidity needs and investment time horizon.
This communication is provided for informational purposes only and is not an offer, recommendation, or solicitation to buy or sell any security or other investment. This communication does not constitute, nor should it be regarded as, investment research or a research report, a securities or investment recommendation, nor does it provide information reasonably sufficient upon which to base an investment decision. Additional analysis of your or your client’s specific parameters would be required to make an investment decision. This communication is not based on the investment objectives, strategies, goals, financial circumstances, needs or risk tolerance of any client or portfolio and is not presented as suitable to any other particular client or portfolio. Securities and investment advice offered through Investment Planners, Inc. (Member FINRA/SIPC) and IPI Wealth Management, Inc., 226 W. Eldorado Street, Decatur, IL 62522. 217-425-6340.

Recent Comments