The Timber Log is a quick overview of Timber Point Capital’s most recent investment thoughts. If you have questions about the content, please reach out to Patrick Mullin. The information contained herein does not constitute investment advice or a recommendation for you to purchase or sell any specific security.

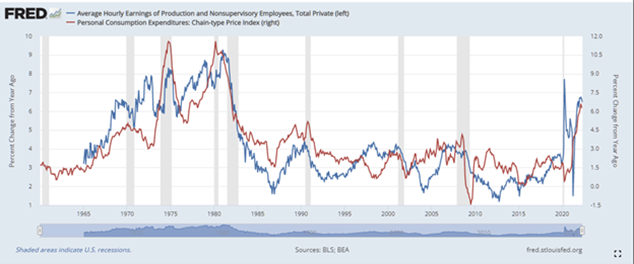
Focus on wage growth as the Fed’s favorite measure, PCE, tracks it pretty well…
- Longer term data for wages (production & non-supervisory, blue line) show they have been subdued for last ~ 35 years
- Subdued in that they are < 4% or so, until 2020 when Covid-19 created volatility in the series
- Recent readings indicate yearly growth in the 6-7% range, a bit hotter than the March ’22 Employment Cost Index level of 4.8% for private compensation
- Historically, PCE index (red line) tracks the general level of wages – elevated in ‘70’s and currently
- Recent US Jobs report (390K added vs. 328K estimate) suggests wages will remain elevated
- As does demand for labor with 11.5M vacancies vs. supply of 6M unemployed people…
- JOLTS data “quits” rate in April shows holding steady for past 5 months…labor still has upper hand
- Good news is that labor force participation rate (25-54 year olds) is approaching pre-pandemic levels (83 vs. 82.4)
- We have seen a number of hiring freezes recently (TWTR, TSLA, NFLX, FB, CRM, COIN) which could lessen pressure between job vacancies and available labor
- Powell is clearly focused on wages, looking to moderate demand to lower job vacancies – “we can’t allow a wage price spiral to happen…”

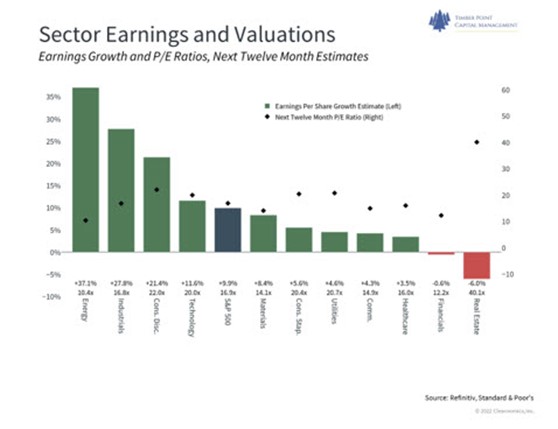
Energy sector is still cheap on absolute and PE/Growth basis…
- At 4100 SPX and $229 ’22 EPS estimate (Factset), market trades at 18x estimated earnings
- Energy, Industrials and Consumer Discretionary all have growth estimates in excess of 20%
- Given oil and natural gas price increases we expect big revenue gains from Energy names
- Industrials and Consumer Disc revenues may benefit from inflation, but margins are a concern given input cost increases as is economic growth sustainability
- Technology estimated to be an 11% grower but with a 20x multiple; further price reset may be needed especially if economy falters – tech is still cyclical!
- Balance of sectors are sub 10% growers or negative (RE); Staples and Utes, trading in excess of market multiple are defensive plays
- On PE/Growth, Energy is cheapest; Staples, Utes, Comms and Hcare are most expensive as investors pay up for steadier business models
- Earnings revisions have been fairly minimal to date…’22 SPX earnings estimate of $227.85 has risen to $229.50 (Factset)
- Largest positive earnings estimate revisions to Energy (24%) and Materials (9.3%); Cons Disc largest negative revision at (-10.8%) (Factset)

US Equity market still trades at substantial premium to global markets…
- US Large Cap names trade at ~ 130% of global markets PE valuation, even after significant decline
- This despite EPS growth rates that are fairly similar in the high single digit range (ex Japan)
- Financial productivity is a key differentiator – ROE’s substantially higher in US vs. ROW
- Global market valuations also impacted by government policy (think China), geopolitical turmoil (Ukraine), tax and regulatory regimes that stifle innovation
- Other difference between EPS multiples is greater energy and material coupled with less technology exposure which compresses valuation multiples OUS
- Is there reason to believe that global markets are becoming more attractive? Tempting but not much evidence to suggest policies are changing – ex Euro energy supply dynamics
- US Small Cap trading just below 1.0x PE/Growth is interesting…access to capital is an issue as many are not profitable and hurt by rising high yield levels with equity capital markets shut down
- More conservative small cap index, S&P 600 (IJR), down 10% vs. SPX 500 down 13%…R2K small cap index (more money losers) down 14.5% YTD
IMPORTANT DISCLOSURES
The information in this report was prepared by Timber Point Capital Management, LLC. Opinions represent TPCM’ sand IPI’s opinion as of the date of this report and are for general information purposes only and are not intended to predict or guarantee the future performance of any individual security, market sector or the markets generally. IPI does not undertake to advise you of any change in its opinions or the information contained in this report. The information contained herein constitutes general information and is not directed to, designed for, or individually tailored to, any particular investor or potential investor.
This report is not intended to be a client-specific suitability analysis or recommendation, an offer to participate in any investment, or a recommendation to buy, hold or sell securities. Do not use this report as the sole basis for investment decisions. Do not select an asset class or investment product based on performance alone. Consider all relevant information, including your existing portfolio, investment objectives, risk tolerance, liquidity needs and investment time horizon.
This communication is provided for informational purposes only and is not an offer, recommendation, or solicitation to buy or sell any security or other investment. This communication does not constitute, nor should it be regarded as, investment research or a research report, a securities or investment recommendation, nor does it provide information reasonably sufficient upon which to base an investment decision. Additional analysis of your or your client’s specific parameters would be required to make an investment decision. This communication is not based on the investment objectives, strategies, goals, financial circumstances, needs or risk tolerance of any client or portfolio and is not presented as suitable to any other particular client or portfolio. Securities and investment advice offered through Investment Planners, Inc. (Member FINRA/SIPC) and IPI Wealth Management, Inc., 226 W. Eldorado Street, Decatur, IL 62522. 217-425-6340.

Recent Comments