The Timber Log is a quick overview of Timber Point Capital’s most recent investment thoughts. If you have questions about the content, please reach out to Patrick Mullin. The information contained herein does not constitute investment advice or a recommendation for you to purchase or sell any specific security.

CPI Inflation figures – rental prices for shelter and food now the main culprits
- Core CPI suprises to the upside…shelter rental (OER) and food are primary culprits
- OER lags home prices by 12 – 18 months and is 33% of CPI…will be elevated for awhile
- According to Nat’l Assoc of Realtors (NAR), existing home prices fell for 1st month in July
- Some CPI components are now in decline m/m – gasoline, rental cars/trucks and airline fares
- “Putin price hike” talking points dispelled…gasoline prices have declined for past 12 weeks
- Ironic that Inflation Reduction Act ceremony held on same day CPI released…golf clap please
- At 8% annualized, inflation is essentially taking one month of pay out of workers pockets
- 75bps coming our way this Wednesday; ZIRP to 3% fed funds rate in 6 months…
- Interesting that a number of spectators (Musk, Gundlach) calling for 25bps…recession fears
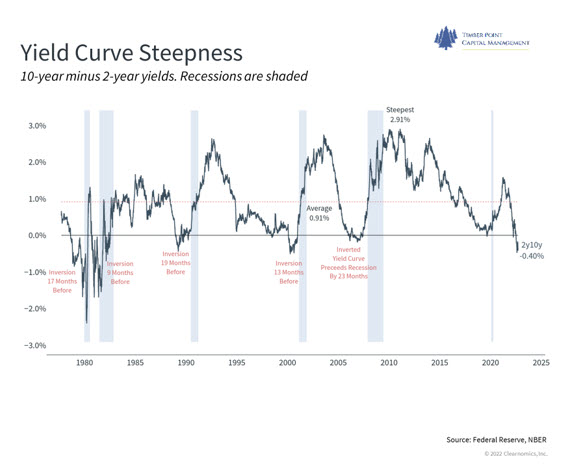
- Yield curve inverted on 2/10’s, has been harbinger of recession in the past
- All eyes on PCE report 9/26…this is the Fed’s preferred inflation tracker

PPI figures give a bit of respite on inflation – market shrugs it off
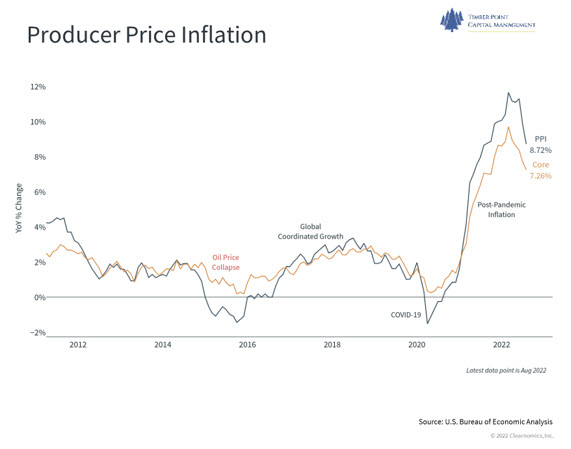
- PPI report shows input prices down .1% m/m…up 8.7% y/y vs 9.8% in July…lowest since 8/21
- Goods price increases down 1.2% while wholesale services increase by .4%…
- Goods decline largely led by lower gasoline prices, down -12.7% m/m
- Services inflation continues elevated trend as post-Covid consumption normalizes back to services
- Recent FedEx report consistent with 2nd month of negative m/m results in transport/warehouse services
- Why care? PPI prices feed into consumer prices, provide window on overall pricing in economy
- Factset Earnings Insight estimates 3Q22 revenue growth of 8.7% vs. earnings growth of 3.7%…margin pressures continue

QT (quantitative tightening) ramps up…watch the “excess reserves”
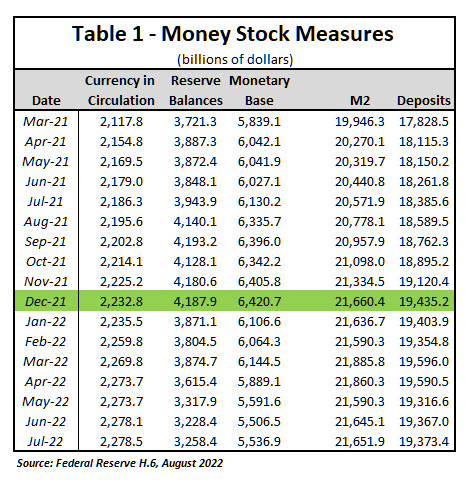
- An analysis of the monetary base provides look at how QT is currently being accomplished
- Monetary base mirrors the balance sheet of the Fed…to buy bonds (assets), Fed prints money
- This money circulates in the economy or is used as reserves against deposits to make loans
- Surprisingly, since 12/21, Fed has lowered monetary base by $1 trillion, down 14%
- Yet inflation remains high, how does this square with inflation as a monetary phenomenon?
- Money in circulation is unchanged, entire reduction is from reserve balances
- Reserves are required to back deposits…but deposit levels in economy have not changed
- Thus, actual reserves could not have not changed…implies reduction in excess/idle reserves
- QT has been removing excess reserves, has not had impact on money supply or credit creation
- However, QT impact will be felt…slow at first and then accelerate with negative yield impact
- Less excess reserves puts economy at greater risk in times of crisis
- Let us know if you would like a copy of Victor Canto’s deep dive on excess reserves

Revisiting the Consumer…how is spending holding up in spite of inflation prints?
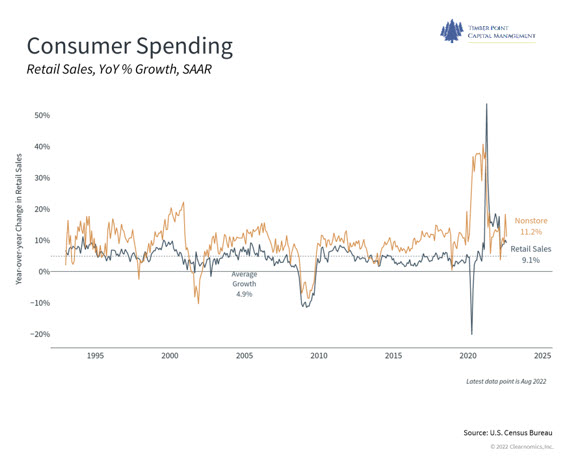
- August Retail and Food Services rose .3% m/m and 9.1% y/y…consumer spend remains healthy
- Increases in motor vehicles/parts of 2.8%, building materials/garden and food services up 1.1%
- Declines in Furniture/furnishings down -1.3%, gasoline stations -4.2%, nonstore+ retailers -.7%
- Interestingly, online sales were down -.7% as consumers do more “on site” purchasing…further evidence that purchases of online goods giving way to in person services
- Employment outlook is still positive for the consumer…more jobs than job seekers and Initial Unemployment Claims, a leading indicator, remain subdued
- Average hourly earnings are running 6%, up 2x vs. pre-pandemic levels…though on inflation adjusted basis, “real” earnings are declining
- Personal Savings levels have declined from Covid related stimulus but still healthy and in approximate range of 2010 – 2020 levels, are above 2000 – 2010 levels
- Household debt, both housing and non-housing, continues to grow, totals $16 trillion, up 10% from pre-Covid levels
- Household debt service as % of disposable income has trended up from Q21 multi-decade level low of 8.3%, now at 9.5%…still below prior decade level of 10%+
- If we are entering, or already in a recession, the consumer is in a better starting position with still strong employment prospects, higher personal savings and less debt relative to income than in Financial Crisis era…
IMPORTANT DISCLOSURES The information in this report was prepared by Timber Point Capital Management, LLC. Opinions represent TPCM’s and IPI’s’ opinion as of the date of this report and are for general information purposes only and are not intended to predict or guarantee the future performance of any individual security, market sector or the markets generally. IPI does not undertake to advise you of any change in its opinions or the information contained in this report. The information contained herein constitutes general information and is not directed to, designed for, or individually tailored to, any particular investor or potential investor. This report is not intended to be a client-specific suitability analysis or recommendation, an offer to participate in any investment, or a recommendation to buy, hold or sell securities. Do not use this report as the sole basis for investment decisions. Do not select an asset class or investment product based on performance alone. Consider all relevant information, including your existing portfolio, investment objectives, risk tolerance, liquidity needs and investment time horizon. This communication is provided for informational purposes only and is not an offer, recommendation, or solicitation to buy or sell any security or other investment. This communication does not constitute, nor should it be regarded as, investment research or a research report, a securities or investment recommendation, nor does it provide information reasonably sufficient upon which to base an investment decision. Additional analysis of your or your client’s specific parameters would be required to make an investment decision. This communication is not based on the investment objectives, strategies, goals, financial circumstances, needs or risk tolerance of any client or portfolio and is not presented as suitable to any other particular client or portfolio. Securities and investment advice offered through Investment Planners, Inc. (Member FINRA/SIPC) and IPI Wealth Management, Inc., 226 W. Eldorado Street, Decatur, IL 62522. 217-425-6340.


Recent Comments