
The Week That Was
Cautious optimism around a potential U.S.-Iran agreement, lower oil prices, and broader participation beyond mega-cap technology helped offset mixed inflation data and AI-related volatility. Small caps led the advance, with the R2K up 3.9%, while the SPX gained 0.6%, the Nasdaq rose 0.7%, and the DJIA advanced 0.7%. Value outperformed growth across the market cap spectrum and the S&P Equal Weight Index moved to new highs later in the week, confirming a broadening equity market.
Investors initially looked through weekend missile exchanges between Iran and Israel, but grew more concerned after reports of additional U.S.-Iran hostilities. Reports that the U.S. and Iran were close to an agreement lifted sentiment later in the week as President Trump cancelled planned strikes. The SpaceX IPO drew significant attention, while semiconductor shares rebounded after recent downdrafts, the XLK gaining 2.5%.
Headline CPI inflation rose 0.5% m/m and 4.2% y/y in May, the highest annual reading since April 2023, driven by energy prices. Core CPI rose 0.2% m/m and 2.9% y/y. PPI was hotter at the headline level, rising 1.1% m/m and 6.5% y/y, the biggest annual increase since November 2022, while core PPI rose 0.4% m/m. Consumer sentiment improved, but inflation expectations remained high at 4.6% for the year ahead.
Initial jobless claims rose to 229K, the highest level since early February, while continuing claims increased to 1.795M. Existing home sales rose 3.2% in May to a five-month high of 4.17M, and the Atlanta Fed's GDPNow estimate for Q2 growth was revised up to 3.3%.
10-year Treasury yield fell to 4.49%, and the two-year yield declined to 4.09%. Credit quality remains strong as spreads over Treasuries contracted. Oil led commodities lower, as WTI crude fell 7% and traded below $90 on a possible U.S.-Iran peace deal. Natural gas declined 3.3%, gold fell 2.6%, and silver edged up 0.1%.
The USD Index declined as the euro strengthened following the ECB rate hike.
U.S. Equity Market Summary — As of 6/12/26
| Asset Class | 1 Wk | 1 Mo | 3 Mo | YTD | 1 Yr | 3 Yr | 5 Yr |
|---|---|---|---|---|---|---|---|
| S&P 500 | 0.66% | 0.54% | 11.70% | 9.15% | 24.44% | 21.28% | 13.47% |
| Dow Jones Industrials | 0.66% | 3.15% | 10.12% | 7.36% | 21.18% | 16.65% | 10.31% |
| NASDAQ | 0.70% | -0.68% | 16.23% | 11.71% | 32.49% | 25.23% | 13.81% |
| S&P MidCap 400 | 2.78% | 3.77% | 13.81% | 15.51% | 26.04% | 15.86% | 8.30% |
| Russell 2000 | 3.90% | 3.70% | 18.65% | 19.22% | 39.31% | 17.89% | 6.18% |
| Russell Micro Cap | 4.29% | 2.17% | 17.29% | 20.41% | 52.77% | 21.15% | 5.54% |
U.S. Sector Summary — As of 6/12/26
| Cyclical Sectors | 1 Wk | 1 Mo | 3 Mo | YTD | 1 Yr | 3 Yr | 5 Yr |
|---|---|---|---|---|---|---|---|
| Consumer Cyclical | 1.51% | -1.43% | 4.76% | -2.16% | 9.97% | 13.37% | 6.99% |
| Financials | 1.99% | 3.41% | 9.79% | -2.11% | 6.19% | 19.09% | 9.14% |
| Materials | 3.06% | 0.08% | 5.49% | 15.56% | 20.33% | 11.72% | 6.00% |
| Real Estate | 1.48% | 1.75% | 8.36% | 13.17% | 11.12% | 10.66% | 3.31% |
| Sensitive Sectors | 1 Wk | 1 Mo | 3 Mo | YTD | 1 Yr | 3 Yr | 5 Yr |
|---|---|---|---|---|---|---|---|
| Comm. Services | -0.02% | -3.63% | -2.83% | -4.86% | 9.07% | 21.72% | 8.03% |
| Energy | -0.21% | -0.03% | 0.72% | 29.55% | 37.20% | 16.35% | 20.09% |
| Industrials | 1.15% | 1.05% | 6.92% | 13.89% | 24.10% | 21.33% | 12.92% |
| Technology | 2.50% | 5.48% | 34.23% | 28.52% | 53.23% | 30.54% | 22.02% |
| Defensive Sectors | 1 Wk | 1 Mo | 3 Mo | YTD | 1 Yr | 3 Yr | 5 Yr |
|---|---|---|---|---|---|---|---|
| Consumer Defensive | 2.85% | 1.63% | 2.43% | 11.10% | 7.61% | 8.40% | 6.64% |
| Health Care | 0.52% | 5.46% | 2.85% | -0.23% | 14.43% | 7.29% | 6.00% |
| Utilities | 0.41% | -1.46% | -3.57% | 5.03% | 11.82% | 13.77% | 9.40% |
US Equity Style Summary — As of 6/12/26
| Equity Style | 1 Wk | 1 Mo | 3 Mo | YTD | 1 Yr | 3 Yr | 5 Yr |
|---|---|---|---|---|---|---|---|
| Large Growth | -0.68% | -1.42% | 12.57% | 5.04% | 21.27% | 23.73% | 13.82% |
| Large Blend | 0.59% | 0.70% | 11.79% | 8.83% | 24.03% | 21.47% | 13.05% |
| Large Value | 2.45% | 4.15% | 10.83% | 14.34% | 26.93% | 18.43% | 11.78% |
| Mid Growth | 1.37% | 3.39% | 13.00% | 6.72% | 9.57% | 15.16% | 6.17% |
| Mid Blend | 1.65% | 3.36% | 10.89% | 10.47% | 18.20% | 16.17% | 7.80% |
| Mid Value | 1.86% | 3.35% | 9.30% | 12.91% | 24.38% | 16.53% | 8.99% |
| Small Growth | 2.55% | 2.38% | 16.26% | 16.38% | 29.82% | 16.62% | 4.83% |
| Small Blend | 2.83% | 3.55% | 14.09% | 15.39% | 28.78% | 16.62% | 6.94% |
| Small Value | 3.03% | 4.46% | 12.48% | 14.65% | 27.98% | 16.58% | 8.39% |
International Equity Market Summary — As of 6/12/26
European equities advanced as the Iran peace deal narrative reduced geopolitical risk premiums and the ECB delivered its first rate hike since 2023. The STOXX Europe 600 rose 1.7%, with the CAC 40 up 1.6% and the FTSE 100 up 1.0%, while Germany's DAX declined 0.5%. The ECB raised rates for the first time since 2023, with inflation estimates for the eurozone at 3.0% for 2026, 2.3% for 2027, and 2.0% for 2028. GDP forecasts were lowered to 0.8% for 2026 and 1.2% for 2027. German industrial production rose 0.4% m/m in April; French inflation rose to 2.4%; UK GDP contracted 0.1% m/m in April. The Swiss National Bank held rates steady at 0.25%. Sweden's Riksbank cut rates by 25 basis points to 2.00%.
Japan's Nikkei 225 declined 0.9% and the TOPIX fell 1.7% for the week, though markets rallied after President Trump pulled back strikes against Iran. The yen remained near JPY 160/USD. The Bank of Japan is expected to hike rates 25 basis points to 1.00% at its June 15–16 meeting. The 10-year JGB yield fell slightly to 2.63%. Japan's Q1 GDP was revised to -0.7% annualized, reflecting weakness in domestic consumption and exports. Machinery orders rose 2.9% m/m in April, suggesting some recovery in capital investment.
China's Shanghai Composite edged up 0.1%. Exports rose 19.4% year-over-year in May, imports up 27.4%, and the trade surplus widened to $105.4B. PPI rose 3.9% y/y while CPI remained subdued at 1.2%. The Hong Kong Hang Seng index declined 1.0%. The People's Bank of China held its benchmark lending rate steady. New yuan loans came in below expectations at CNY 950B in May, reflecting cautious credit demand despite policy support.
Emerging markets were broadly positive, with Latin America leading gains as the MSCI Latin America index rose 4.21% on the week. Brazil's Bovespa rose on commodity strength and easing global risk premiums. India's Sensex gained modestly as domestic inflation remained within the RBI's target band. South Korea and Taiwan outperformed on semiconductor strength following the XLK rebound. The MSCI Emerging Markets index gained 0.02% for the week, with year-to-date returns of 23.21% reflecting the strong recovery in risk assets since early 2026.
| Region | 1 Wk | 1 Mo | 3 Mo | YTD | 1 Yr | 3 Yr | 5 Yr |
|---|---|---|---|---|---|---|---|
| MSCI ACWI | 0.59% | 1.02% | 11.05% | 10.60% | 25.79% | 20.64% | 11.35% |
| MSCI ACWI ex USA | 0.67% | 1.62% | 9.66% | 13.30% | 28.38% | 18.89% | 8.33% |
| MSCI Emerging Markets | 0.02% | 1.28% | 15.75% | 23.21% | 45.34% | 22.43% | 7.01% |
| MSCI Europe | 1.88% | 3.59% | 7.68% | 7.34% | 17.83% | 16.77% | 8.75% |
| MSCI Asia Pacific | -0.64% | 0.71% | 13.08% | 20.33% | 38.22% | 20.54% | 7.71% |
| MSCI Latin America | 4.21% | -4.19% | 1.95% | 12.51% | 37.52% | 13.28% | 9.22% |
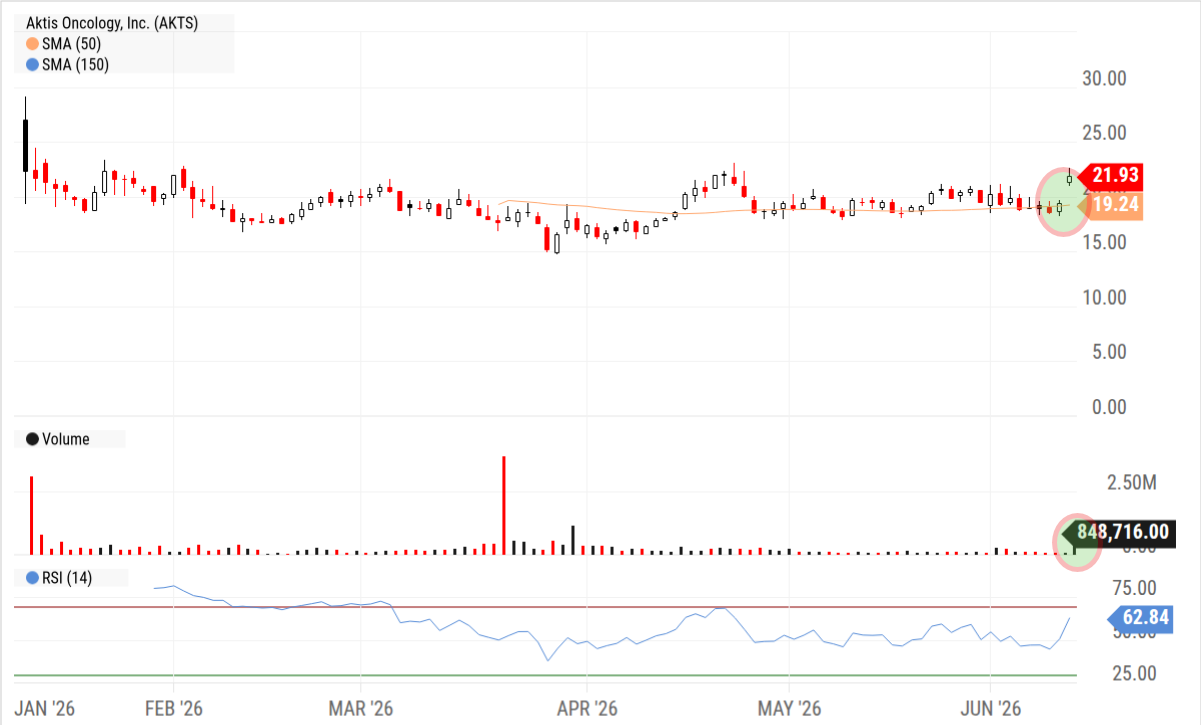
Chart of the Week — 6/15/26
We might be getting over our skis here but we thought this setup was interesting to point out. A gap higher on decent volume for a stock that has been essentially trading sideways since its IPO in early '26. Take it for what it is, but the market seems to be waking up to stocks outside the technology trade and we are keeping our eyes open.
The Week Ahead
Let's get this Strait — good news on the US/Iran peace deal overnight is moving equity markets higher by ~1% as yields move slightly lower and front month WTI crude declines 5%, now near $80. The framework of a deal leaves unanswered questions beyond open transit through the Strait of Hormuz (SoH), which is seen as a big step forward for the global economy. Pending details on issues such as further nuclear enrichment and how Iranian proxies fall in line, not to mention the Israeli response, we remain cautiously optimistic although understanding of the difficulty past 'deals' have had with verification of compliance — some things never change.
Earnings reports are decidedly down market cap this week although JBL (Wed), one of the largest manufacturers for AI-related hardware, will provide an update on future build-out plans for major capex players. ACN (Thur) will hope to convince investors that AI is not disintermediating its business, with the agentic AI buildout and cybersecurity concerns likely the strongest card it has to play. KR (Thur) is dealing with higher input prices making it more difficult to compete with low-cost suppliers such as WMT and COST, at the same time it attempts to accelerate new store openings and expand existing store fronts.
The Fed meets (Wed) with new Chair Warsh taking the reins and no change to the fed funds rate expected. Economic conditions have changed quite a bit over the past few months as employment and energy-driven inflation have both rebounded and investors now see more of a possibility of medium-term rate hikes rather than rate cuts. Expect Warsh to focus on a smaller Fed balance sheet and driving new data sets for economic intelligence.
| Company | Date | EPS Est. |
|---|---|---|
| Dave & Buster's Entertainment (PLAY) | Mon Jun 15 | $0.66 |
| John Wiley & Sons, Inc. (WLY) | Tue Jun 16 | $1.65 |
| La-Z-Boy, Inc. (LZB) | Tue Jun 16 | $0.49 |
| Smith & Wesson Brands (SWBI) | Wed Jun 17 | $0.23 |
| Jabil, Inc. (JBL) | Wed Jun 17 | $3.73 |
| CarMax, Inc. (KMX) | Wed Jun 17 | $0.67 |
| Accenture Plc (ACN) | Thu Jun 18 | $3.27 |
| The Kroger Co. (KR) | Thu Jun 18 | $1.14 |
| America's Car-Mart (CRMT) | Thu Jun 18 | ($0.71) |
| Korn Ferry (KFY) | Thu Jun 18 | $1.33 |
| Data Release | Date | Est. |
|---|---|---|
| Empire State Manufacturing Index | Mon Jun 15 | 12.0 |
| US Industrial Production YoY | Mon Jun 15 | 1.7% |
| NAHB/Wells Fargo Housing Market Index | Mon Jun 15 | 36.0 |
| US Housing Starts | Tue Jun 16 | 1.44M |
| US Building Permits | Tue Jun 16 | 1.41M |
| US Retail Sales YoY | Wed Jun 17 | 4.0% |
| Fed Interest Rate Decision | Wed Jun 17 | N/A |
| Philly Fed Manufacturing Activity Index | Thu Jun 18 | 9.0 |
| US Oil Rig Count | Thu Jun 18 | N/A |
Key Interest Rates — As of 6/11/26
| Rate | As of | Latest | 1 Mo Ago | 1 Mo % | 1 Yr Ago | 1 Yr % |
|---|---|---|---|---|---|---|
| 1 Month Treasury | 6/11/26 | 3.69% | 3.71% | -0.5% | 4.30% | -14.2% |
| 2 Year Treasury | 6/11/26 | 4.05% | 3.95% | 2.5% | 3.94% | 2.8% |
| 10 Year Treasury | 6/11/26 | 4.45% | 4.42% | 0.7% | 4.41% | 0.9% |
| 30 Year Mortgage | 6/11/26 | 6.52% | 6.37% | 2.4% | 6.85% | -4.8% |
| US Corporate AAA | 6/10/26 | 5.08% | 4.97% | 2.2% | 4.93% | 3.0% |
| US Corporate BBB | 6/10/26 | 5.42% | 5.27% | 2.8% | 5.46% | -0.7% |
| US Corporate CCC | 6/10/26 | 13.80% | 13.19% | 4.6% | 13.36% | 3.3% |
| Effective Fed Funds | 6/10/26 | 3.62% | 3.63% | -0.3% | 4.33% | -16.4% |
US Economy Indicators
| Indicator | As of | Latest | 1 Mo Ago | 1 Mo % | 1 Yr Ago | 1 Yr % |
|---|---|---|---|---|---|---|
| Consumer Sentiment | 5/31/26 | 44.80 | 49.80 | -10.0% | 52.20 | -14.2% |
| Unemployment Rate | 5/31/26 | 4.30% | 4.30% | 0.0% | 4.30% | 0.0% |
| Inflation Rate (CPI YoY) | 5/31/26 | 4.20% | 3.80% | 10.5% | 2.40% | 75.0% |
| Manufacturing PMI | 5/31/26 | 54.00 | 52.70 | 2.5% | 48.50 | 11.3% |
| Non-Manufacturing PMI | 5/31/26 | 54.50 | 53.60 | 1.7% | 49.90 | 9.2% |
| Retail Sales ($M) | 4/30/26 | 656,115 | 641,038 | 2.4% | 623,635 | 5.2% |
| Building Permits (K) | 4/30/26 | 1,442 | 1,540 | -6.4% | 1,445 | -0.2% |
Suggested Readings
- 1Institute for the Study of War: Iran Update Special Report, June 14, 2026
- 2Experts React: The US and Iran Announce an Interim Peace Deal. Here's What We Know.
- 3Taiwan Tests HIMARS Missiles on Island's West Coast in Major Live-Fire Drills
- 4How the ECB Rate Rise Shows It Doesn't Want to be Haunted by Ghosts of the Past
- 5Kim Jong Un Unveils New Nuclear Enrichment Plant in Push to Expand Arsenal
Leadership Insight
“If people had told me this was going to happen, I was like, man, you must be smoking some really good crack, because I think this company is going to fail.”
Stocks to Watch
For our full list of Stocks To Watch, contact Patrick Mullin at pmullin@timberpointcapital.com
Cautious optimism around a potential U.S.-Iran agreement, lower oil prices, and broader participation beyond mega-cap technology helped offset mixed inflation data and AI-related volatility. Small caps led the advance, with the R2K up 3.9%, while the SPX gained 0.6%, the Nasdaq rose 0.7%, and the DJIA advanced 0.7%. Value outperformed growth across the market cap spectrum and the S&P Equal Weight Index moved to new highs later in the week, confirming a broadening equity market.
Investors initially looked through weekend missile exchanges between Iran and Israel, but grew more concerned after reports of additional U.S.-Iran hostilities. Reports that the U.S. and Iran were close to an agreement lifted sentiment later in the week as President Trump cancelled planned strikes. The SpaceX IPO drew significant attention, while semiconductor shares rebounded after recent downdrafts, the XLK gaining 2.5%.
Headline CPI inflation rose 0.5% m/m and 4.2% y/y in May, the highest annual reading since April 2023, driven by energy prices. Core CPI rose 0.2% m/m and 2.9% y/y. PPI was hotter at the headline level, rising 1.1% m/m and 6.5% y/y, the biggest annual increase since November 2022, while core PPI rose 0.4% m/m. Consumer sentiment improved, but inflation expectations remained high at 4.6% for the year ahead.
Initial jobless claims rose to 229K, the highest level since early February, while continuing claims increased to 1.795M. Existing home sales rose 3.2% in May to a five-month high of 4.17M, and the Atlanta Fed's GDPNow estimate for Q2 growth was revised up to 3.3%.
10-year Treasury yield fell to 4.49%, and the two-year yield declined to 4.09%. Credit quality remains strong as spreads over Treasuries contracted. Oil led commodities lower, as WTI crude fell 7% and traded below $90 on a possible U.S.-Iran peace deal. Natural gas declined 3.3%, gold fell 2.6%, and silver edged up 0.1%. The USD Index declined as the euro strengthened following the ECB rate hike.
| Asset Class | 1 Wk | 1 Mo | 3 Mo | YTD | 1 Yr | 3 Yr | 5 Yr |
|---|---|---|---|---|---|---|---|
| S&P 500 | 0.66% | 0.54% | 11.70% | 9.15% | 24.44% | 21.28% | 13.47% |
| Dow Jones Industrials | 0.66% | 3.15% | 10.12% | 7.36% | 21.18% | 16.65% | 10.31% |
| NASDAQ | 0.70% | -0.68% | 16.23% | 11.71% | 32.49% | 25.23% | 13.81% |
| S&P MidCap 400 | 2.78% | 3.77% | 13.81% | 15.51% | 26.04% | 15.86% | 8.30% |
| Russell 2000 | 3.90% | 3.70% | 18.65% | 19.22% | 39.31% | 17.89% | 6.18% |
| Russell Micro Cap | 4.29% | 2.17% | 17.29% | 20.41% | 52.77% | 21.15% | 5.54% |
| Sector | 1Wk | YTD |
|---|---|---|
| 1.51% | -2.16% | |
| 1.99% | -2.11% | |
| 3.06% | 15.56% | |
| 1.48% | 13.17% |
| Sector | 1Wk | YTD |
|---|---|---|
| -0.02% | -4.86% | |
| -0.21% | 29.55% | |
| 1.15% | 13.89% | |
| 2.50% | 28.52% |
| Sector | 1Wk | YTD |
|---|---|---|
| 2.85% | 11.10% | |
| 0.52% | -0.23% | |
| 0.41% | 5.03% |
| Style | 1 Wk | 1 Mo | 3 Mo | YTD | 1 Yr | 3 Yr | 5 Yr |
|---|---|---|---|---|---|---|---|
| Large Growth | -0.68% | -1.42% | 12.57% | 5.04% | 21.27% | 23.73% | 13.82% |
| Large Blend | 0.59% | 0.70% | 11.79% | 8.83% | 24.03% | 21.47% | 13.05% |
| Large Value | 2.45% | 4.15% | 10.83% | 14.34% | 26.93% | 18.43% | 11.78% |
| Mid Growth | 1.37% | 3.39% | 13.00% | 6.72% | 9.57% | 15.16% | 6.17% |
| Mid Blend | 1.65% | 3.36% | 10.89% | 10.47% | 18.20% | 16.17% | 7.80% |
| Mid Value | 1.86% | 3.35% | 9.30% | 12.91% | 24.38% | 16.53% | 8.99% |
| Small Growth | 2.55% | 2.38% | 16.26% | 16.38% | 29.82% | 16.62% | 4.83% |
| Small Blend | 2.83% | 3.55% | 14.09% | 15.39% | 28.78% | 16.62% | 6.94% |
| Small Value | 3.03% | 4.46% | 12.48% | 14.65% | 27.98% | 16.58% | 8.39% |
Let's get this Strait — good news on the US/Iran peace deal overnight is moving equity markets higher by ~1% as yields move slightly lower and front month WTI crude declines 5%, now near $80. The framework of a deal leaves unanswered questions beyond open transit through the Strait of Hormuz (SoH), which is seen as a big step forward for the global economy. Pending details on issues such as further nuclear enrichment and how Iranian proxies fall in line, not to mention the Israeli response, we remain cautiously optimistic although understanding of the difficulty past 'deals' have had with verification of compliance — some things never change.
Earnings reports are decidedly down market cap this week although JBL (Wed), one of the largest manufacturers for AI-related hardware, will provide an update on future build-out plans for major capex players. ACN (Thur) will hope to convince investors that AI is not disintermediating its business, with the agentic AI buildout and cybersecurity concerns likely the strongest card it has to play. KR (Thur) is dealing with higher input prices making it more difficult to compete with low-cost suppliers such as WMT and COST, at the same time it attempts to accelerate new store openings and expand existing store fronts.
The Fed meets (Wed) with new Chair Warsh taking the reins and no change to the fed funds rate expected. Economic conditions have changed quite a bit over the past few months as employment and energy-driven inflation have both rebounded and investors now see more of a possibility of medium-term rate hikes rather than rate cuts. Expect Warsh to focus on a smaller Fed balance sheet and driving new data sets for economic intelligence.
| Company | Date | EPS Est. |
|---|---|---|
| Dave & Buster's Entertainment (PLAY) | Mon Jun 15 | $0.66 |
| John Wiley & Sons, Inc. (WLY) | Tue Jun 16 | $1.65 |
| La-Z-Boy, Inc. (LZB) | Tue Jun 16 | $0.49 |
| Smith & Wesson Brands (SWBI) | Wed Jun 17 | $0.23 |
| Jabil, Inc. (JBL) | Wed Jun 17 | $3.73 |
| CarMax, Inc. (KMX) | Wed Jun 17 | $0.67 |
| Accenture Plc (ACN) | Thu Jun 18 | $3.27 |
| The Kroger Co. (KR) | Thu Jun 18 | $1.14 |
| America's Car-Mart (CRMT) | Thu Jun 18 | ($0.71) |
| Korn Ferry (KFY) | Thu Jun 18 | $1.33 |
| Data Release | Date | Est. |
|---|---|---|
| Empire State Manufacturing Index | Mon Jun 15 | 12.0 |
| US Industrial Production YoY | Mon Jun 15 | 1.7% |
| NAHB/Wells Fargo Housing Market Index | Mon Jun 15 | 36.0 |
| US Housing Starts | Tue Jun 16 | 1.44M |
| US Building Permits | Tue Jun 16 | 1.41M |
| US Retail Sales YoY | Wed Jun 17 | 4.0% |
| Fed Interest Rate Decision | Wed Jun 17 | N/A |
| Philly Fed Manufacturing Activity Index | Thu Jun 18 | 9.0 |
| US Oil Rig Count | Thu Jun 18 | N/A |
European equities advanced as the Iran peace deal narrative reduced geopolitical risk premiums and the ECB delivered its first rate hike since 2023. The STOXX Europe 600 rose 1.7%, with the CAC 40 up 1.6% and the FTSE 100 up 1.0%, while Germany's DAX declined 0.5%. The ECB raised rates for the first time since 2023, with inflation estimates for the eurozone at 3.0% for 2026, 2.3% for 2027, and 2.0% for 2028. GDP forecasts were lowered to 0.8% for 2026 and 1.2% for 2027. German industrial production rose 0.4% m/m in April; French inflation rose to 2.4%; UK GDP contracted 0.1% m/m in April. The Swiss National Bank held rates steady at 0.25%. Sweden's Riksbank cut rates by 25 basis points to 2.00%.
Japan's Nikkei 225 declined 0.9% and the TOPIX fell 1.7% for the week, though markets rallied after President Trump pulled back strikes against Iran. The yen remained near JPY 160/USD. The Bank of Japan is expected to hike rates 25 basis points to 1.00% at its June 15–16 meeting. The 10-year JGB yield fell slightly to 2.63%. Japan's Q1 GDP was revised to -0.7% annualized. Machinery orders rose 2.9% m/m in April.
China's Shanghai Composite edged up 0.1%. Exports rose 19.4% y/y in May, imports up 27.4%, and the trade surplus widened to $105.4B. PPI rose 3.9% y/y while CPI remained subdued at 1.2%. The Hong Kong Hang Seng index declined 1.0%. The People's Bank of China held its benchmark lending rate steady. New yuan loans came in below expectations at CNY 950B in May.
Emerging markets were broadly positive, with Latin America leading gains as the MSCI Latin America index rose 4.21% on the week. Brazil's Bovespa rose on commodity strength. India's Sensex gained modestly. South Korea and Taiwan outperformed on semiconductor strength. The MSCI Emerging Markets index gained 0.02% for the week, with YTD returns of 23.21%.
| Region | 1 Wk | 1 Mo | 3 Mo | YTD | 1 Yr | 3 Yr | 5 Yr |
|---|---|---|---|---|---|---|---|
| MSCI ACWI | 0.59% | 1.02% | 11.05% | 10.60% | 25.79% | 20.64% | 11.35% |
| MSCI ACWI ex USA | 0.67% | 1.62% | 9.66% | 13.30% | 28.38% | 18.89% | 8.33% |
| MSCI Emerging Markets | 0.02% | 1.28% | 15.75% | 23.21% | 45.34% | 22.43% | 7.01% |
| MSCI Europe | 1.88% | 3.59% | 7.68% | 7.34% | 17.83% | 16.77% | 8.75% |
| MSCI Asia Pacific | -0.64% | 0.71% | 13.08% | 20.33% | 38.22% | 20.54% | 7.71% |
| MSCI Latin America | 4.21% | -4.19% | 1.95% | 12.51% | 37.52% | 13.28% | 9.22% |
| Rate | Latest | 1 Mo Ago | 1 Mo % | 1 Yr Ago | 1 Yr % |
|---|---|---|---|---|---|
| 1 Month Treasury | 3.69% | 3.71% | -0.5% | 4.30% | -14.2% |
| 2 Year Treasury | 4.05% | 3.95% | 2.5% | 3.94% | 2.8% |
| 10 Year Treasury | 4.45% | 4.42% | 0.7% | 4.41% | 0.9% |
| 30 Year Mortgage | 6.52% | 6.37% | 2.4% | 6.85% | -4.8% |
| US Corporate AAA | 5.08% | 4.97% | 2.2% | 4.93% | 3.0% |
| US Corporate BBB | 5.42% | 5.27% | 2.8% | 5.46% | -0.7% |
| US Corporate CCC | 13.80% | 13.19% | 4.6% | 13.36% | 3.3% |
| Effective Fed Funds | 3.62% | 3.63% | -0.3% | 4.33% | -16.4% |
| Indicator | Latest | 1 Mo Ago | 1 Mo % | 1 Yr Ago | 1 Yr % |
|---|---|---|---|---|---|
| Consumer Sentiment | 44.80 | 49.80 | -10.0% | 52.20 | -14.2% |
| Unemployment Rate | 4.30% | 4.30% | 0.0% | 4.30% | 0.0% |
| Inflation Rate (CPI YoY) | 4.20% | 3.80% | 10.5% | 2.40% | 75.0% |
| Manufacturing PMI | 54.00 | 52.70 | 2.5% | 48.50 | 11.3% |
| Non-Manufacturing PMI | 54.50 | 53.60 | 1.7% | 49.90 | 9.2% |
| Retail Sales ($M) | 656,115 | 641,038 | 2.4% | 623,635 | 5.2% |
| Building Permits (K) | 1,442 | 1,540 | -6.4% | 1,445 | -0.2% |
We might be getting over our skis here but we thought this setup was interesting to point out. A gap higher on decent volume for a stock that has been essentially trading sideways since its IPO in early '26. Take it for what it is, but the market seems to be waking up to stocks outside the technology trade and we are keeping our eyes open.
“If people had told me this was going to happen, I was like, man, you must be smoking some really good crack, because I think this company is going to fail.”
For our full list of Stocks To Watch, contact Patrick Mullin at pmullin@timberpointcapital.com
©2020 YCharts, Inc. All Rights Reserved. YCharts, Inc. ("YCharts") is not registered with the U.S. Securities and Exchange Commission as an investment adviser, broker-dealer or in any other capacity, and does not purport to provide investment advice or make investment recommendations. This report has been generated through application of the analytical tools and data provided through ycharts.com and is intended solely to assist you or your investment or other adviser(s) in conducting investment research.
All data, statistics and charts are courtesy of YCharts unless otherwise noted. Investment Advice is offered through Fortis Capital Advisors, LLC, 7301 Mission Road, Suite 326, Prairie Village, KS 66208.
While reasonable efforts were used to obtain information from sources believed to be reliable, Fortis Capital Advisors, LLC makes no representation that the information or opinions contained in this material are accurate, reliable, or complete. All information and opinions are subject to change without notice. You should not construe this report as an offer to buy or sell, as a solicitation of an offer to buy or sell, or as a recommendation to buy, sell, hold or trade, any security or other financial instrument.
Past performance is not indicative of future results. Investing involves risk, including the possible loss of principal. The information contained herein is provided for informational purposes only and should not be construed as investment, tax, or legal advice. Recipients should consult their own advisers before making any investment decisions.
Source: Timber Point Capital Management. Powered by Fortis Capital Advisors. Investment Advice is offered through Fortis Capital Advisors, LLC, 7301 Mission Road, Suite 326, Prairie Village, KS 66208. All rights reserved.