
The Week That Was
In a holiday shortened week, U.S. equity indexes finished higher as progress toward a U.S.-Iran agreement lowered oil prices and supported risk appetite, though hawkish commentary from new Fed Chair Warsh's first meeting produced a sharp midweek reversal. The Nasdaq led with a 2.4% gain, followed by the Russell 2000 at 1.2%, the S&P 500 at 0.9%, and the DJIA at 0.9%.
The Fed held the fed funds target range at 3.50% to 3.75%, as expected, but nine of 18 officials projected at least one rate increase in 2026, with six expecting two or more hikes. 2026 forecasts for headline PCE inflation rose to 3.6% and core PCE to 3.3%. Consumer spending remained resilient highlighted by retail sales rising 0.9% in May, ahead of expectations, while sales excluding autos increased 0.8% and control-group sales advanced 0.7%. Housing remained difficult as the NAHB Housing Market Index fell to 35 and housing starts dropped 15.4% to a 1.177M annual rate, the lowest level since May '20. Building permits came in at 1.413M, roughly flat y/y while pending home sales were stronger, increasing 4.8% y/y, after a 3.8% April increase.
Front-end Treasury yields rose sharply as rate-hike expectations increased, while longer maturities were roughly flat to slightly higher, narrowing the 2-year/10-year spread to about 25 bps, its flattest since early 2025. TIPS breakevens suggest markets expect inflation to return toward 2% over the next two years, perhaps egged on by Chair Warsh's commentary about more work to be done on the inflation front. WTI crude fell 9.7% and traded near $75 as the U.S.-Iran MOU took effect and some energy traffic began moving through the Strait of Hormuz. However, tight inventories and intermittent military activity mean volatility could remain elevated. Natural gas rose 3.6%, gold was essentially flat with a 0.1% gain, and silver declined 3.1%. The USD strengthened following the Fed's hawkish shift, while USD/JPY approached the critical 160 level and renewed intervention speculation.
U.S. Equity Market Summary — As of 6/19/26
| Asset Class | 1 Wk | 1 Mo | 3 Mo | YTD | 1 Yr | 3 Yr | 5 Yr |
|---|---|---|---|---|---|---|---|
| S&P 500 | 1.47% | 1.45% | 13.56% | 10.20% | 26.93% | 21.00% | 14.11% |
| Dow Jones Industrials | 1.41% | 4.04% | 12.02% | 8.16% | 24.33% | 16.66% | 11.25% |
| NASDAQ | 2.74% | 1.72% | 19.90% | 14.43% | 36.50% | 25.53% | 14.42% |
| S&P MidCap 400 | 0.58% | 5.35% | 13.11% | 15.41% | 27.15% | 15.43% | 9.41% |
| Russell 2000 | 2.01% | 7.51% | 20.57% | 20.70% | 42.80% | 18.30% | 7.35% |
| Russell Micro Cap | 2.80% | 7.86% | 21.51% | 22.50% | 57.59% | 22.00% | 6.70% |
U.S. Sector Summary — As of 6/19/26
| Cyclical Sectors | 1 Wk | 1 Mo | 3 Mo | YTD | 1 Yr | 3 Yr | 5 Yr |
|---|---|---|---|---|---|---|---|
| Consumer Cyclical | 0.74% | 0.72% | 6.17% | -1.69% | 12.22% | 13.00% | 7.22% |
| Financials | 1.81% | 3.54% | 9.95% | -1.69% | 8.31% | 18.74% | 10.65% |
| Materials | 1.15% | 3.17% | 7.34% | 14.75% | 21.40% | 10.36% | 7.22% |
| Real Estate | -2.36% | 0.25% | 5.08% | 9.42% | 8.44% | 8.85% | 3.12% |
| Sensitive Sectors | 1 Wk | 1 Mo | 3 Mo | YTD | 1 Yr | 3 Yr | 5 Yr |
|---|---|---|---|---|---|---|---|
| Comm. Services | -2.38% | -6.44% | -3.40% | -6.73% | 7.08% | 20.42% | 7.94% |
| Energy | -5.86% | -11.24% | -7.38% | 21.04% | 26.02% | 13.60% | 19.79% |
| Industrials | 3.29% | 5.95% | 9.83% | 16.95% | 28.91% | 21.50% | 14.40% |
| Technology | 4.49% | 9.80% | 38.93% | 33.13% | 59.36% | 31.17% | 22.86% |
| Defensive Sectors | 1 Wk | 1 Mo | 3 Mo | YTD | 1 Yr | 3 Yr | 5 Yr |
|---|---|---|---|---|---|---|---|
| Consumer Defensive | -2.31% | -3.03% | 1.36% | 7.84% | 6.43% | 6.57% | 6.66% |
| Health Care | -3.04% | 2.53% | 1.95% | -3.09% | 14.12% | 5.90% | 5.52% |
| Utilities | 1.61% | 1.87% | -3.55% | 5.57% | 14.26% | 13.38% | 10.19% |
US Equity Style Summary — As of 6/19/26
| Equity Style | 1 Wk | 1 Mo | 3 Mo | YTD | 1 Yr | 3 Yr | 5 Yr |
|---|---|---|---|---|---|---|---|
| Large Growth | 2.22% | 0.00% | 16.19% | 7.19% | 25.04% | 23.80% | 14.18% |
| Large Blend | 1.55% | 1.65% | 13.82% | 10.00% | 26.63% | 21.22% | 13.66% |
| Large Value | 0.66% | 4.41% | 10.66% | 14.02% | 27.84% | 17.74% | 12.67% |
| Mid Growth | 3.83% | 7.83% | 15.71% | 9.91% | 13.26% | 15.64% | 6.81% |
| Mid Blend | 1.36% | 4.59% | 10.96% | 10.89% | 19.56% | 15.60% | 8.44% |
| Mid Value | -0.53% | 2.13% | 7.37% | 11.10% | 23.72% | 15.13% | 9.77% |
| Small Growth | 2.10% | 6.70% | 16.51% | 18.38% | 32.81% | 16.97% | 5.54% |
| Small Blend | 0.73% | 5.41% | 13.41% | 15.45% | 29.98% | 16.28% | 7.84% |
| Small Value | -0.31% | 4.43% | 11.09% | 13.26% | 27.83% | 15.72% | 9.40% |
International Equity Market Summary — As of 6/19/26
European equities advanced as lower oil prices and progress toward a U.S.-Iran agreement reduced inflation and growth concerns. The STOXX Europe 600 gained 0.6%, Germany's DAX rose 1.6%, France's CAC 40 advanced 1.4%, and Italy's FTSE MIB gained 2.3%, while the FTSE 100 declined 0.7%. The eurozone recorded a EUR 1B trade deficit in April instead of the expected surplus as the energy deficit widened. German wholesale inflation slowed to 5.9% y/y from 6.3%, while the ZEW sentiment index returned to positive territory for the first time since the Middle East war began. The BoE held its base rate at 3.75%, with U.K. inflation steady at 2.8%.
Japan surged, with the Nikkei 225 up 7.6% and the TOPIX gaining 4.8%, led by semiconductor equipment and technology shares tied to global AI investment. The BoJ raised its short-term policy rate by 25 bps to 1.00%, the highest level since 1995, and announced another reduction in monthly JGB purchases. Deputy Governor Uchida delivered a hawkish message highlighting the possibility that underlying inflation could exceed the 2% target. The 10-year JGB yield fell to 2.61%, while the yen weakened to around JPY 160.8 versus USD.
China equities were positive as the CSI 300 rose 3.4% and the Shanghai Composite gained 1.5%. Industrial production increased 4.5% y/y, but retail sales fell 0.6%, the first annual decline since late 2022. Fixed asset investment contracted 4.1% for January through May. Property investment fell 16.2% y/y, although first-tier city home prices rose for a third month. The PBOC announced measures to improve short-term liquidity management but the package fell short of broad stimulus measures. Hong Kong's Hang Seng declined 3.2%.
| Region | 1 Wk | 1 Mo | 3 Mo | YTD | 1 Yr | 3 Yr | 5 Yr |
|---|---|---|---|---|---|---|---|
| MSCI ACWI | 0.59% | 1.02% | 11.05% | 10.60% | 25.79% | 20.64% | 11.35% |
| MSCI ACWI ex USA | 0.67% | 1.62% | 9.66% | 13.30% | 28.38% | 18.89% | 8.33% |
| MSCI Emerging Markets | 0.02% | 1.28% | 15.75% | 23.21% | 45.34% | 22.43% | 7.01% |
| MSCI Europe | 1.88% | 3.59% | 7.68% | 7.34% | 17.83% | 16.77% | 8.75% |
| MSCI Asia Pacific | -0.64% | 0.71% | 13.08% | 20.33% | 38.22% | 20.54% | 7.71% |
| MSCI Latin America | 4.21% | -4.19% | 1.95% | 12.51% | 37.52% | 13.28% | 9.22% |
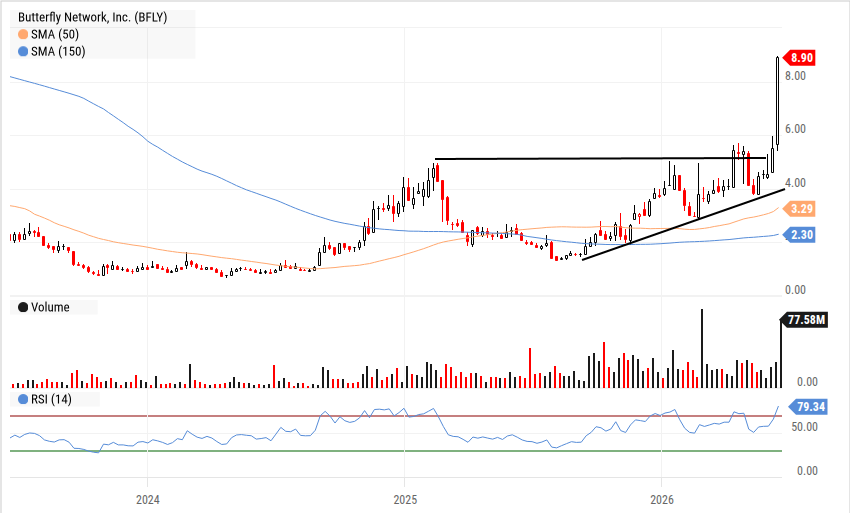
Chart of the Week — 6/22/26
BFLY has been in an uptrend for the better part of the past year. Recent attempts to break thru the $6 level were met with resistance until last week. We view the price and volume as confirming of an intermediate move higher.
The Week Ahead
Fed Chair Warsh's commentary that “persistently high prices are a burden for the American people” and his insistence that the Fed is highly focused on fighting inflation, makes the first PCE price index report (Thur) of his tenure a bit more interesting. Expect a headline 4% print, driven by higher energy/oil prices. The core reading, ex food/energy, will be more enlightening as April's figure of 3.3% was the latest of 5 consecutive monthly increases since November's print of 2.8% - driven by durable goods that are rising at a 3.4% rate owing to trade tariffs and supply chain structures that have turned a historically deflationary force into an inflationary one. Expect increasing odds of a rate hike later in the year, a 180 degree turnaround from rate cuts the market expected Warsh to deliver just a few months ago. US GDP final report (Thur) should be in the mid 3% range, a continued strong showing, led by the AI buildout.
On the earnings front, MU (Wed) is the highlight as it is expected to report blow out rev growth of almost 300% while earnings will approach $20/share, up over 900% y/y. Of course, the go forward commentary will be parsed for any hints of demand weakness or double ordering as well as timing of additional capacity coming on line to help with supply shortages. We will also be focused on CCL and DRI for a read on how consumer spending is holding up for leisure and dining out activities.
Crude oil prices remain on the radar following the US-Iran signing of the MOU - we note that many of the energy related names have pulled back to their 200 dma and remain in uptrends. Given the amout of restocking needed, we believe crude prices will remain in the $70-$80 range, still quite profitable for producers making for a opportunistic entry point.
| Company | Date | EPS Est. |
|---|---|---|
| Carnival Corp. Ltd. (CCL) | Tue Jun 23 | $1.42 |
| Korn Ferry (KFY) | Tue Jun 23 | $1.33 |
| KB Home (KBH) | Tue Jun 23 | $0.88 |
| Worthington Enterprises, Inc. (WOR) | Tue Jun 23 | $1.06 |
| Paychex, Inc. (PAYX) | Wed Jun 24 | $1.31 |
| H.B. Fuller Co. (FUL) | Wed Jun 24 | $1.40 |
| Jefferies Financial Group, Inc. (JEF) | Wed Jun 24 | $0.98 |
| Micron Technology, Inc. (MU) | Wed Jun 24 | $24.37 |
| Acuity, Inc. (AYI) | Thu Jun 25 | $5.53 |
| Darden Restaurants, Inc. (DRI) | Thu Jun 25 | $2.12 |
| Data Release | Date | Est. |
|---|---|---|
| S&P Global Composite PMI Flash | Tue Jun 23 | 50.8 |
| Richmond Fed Manufacturing Index | Tue Jun 23 | 7.0 |
| US New Single Family Houses Sold | Wed Jun 24 | 640K |
| US PCE Price Index YoY | Thu Jun 25 | 4.0% |
| US Durable Goods Excl. Defense New Orders YoY | Thu Jun 25 | -3.9% |
| US GDP | Thu Jun 25 | 3.5% |
| Goods Trade Balance Advanced | Thu Jun 25 | -81.0B |
| US Oil Rig Count | Thu Jun 25 | N/A |
Key Interest Rates — As of 6/18/26
| Rate | As of | Latest | 1 Mo Ago | 1 Mo % | 1 Yr Ago | 1 Yr % |
|---|---|---|---|---|---|---|
| 1 Month Treasury | 6/18/26 | 3.69% | 3.69% | 0.0% | 4.20% | -12.1% |
| 2 Year Treasury | 6/18/26 | 4.19% | 4.07% | 2.9% | 3.94% | 6.3% |
| 10 Year Treasury | 6/18/26 | 4.46% | 4.61% | -3.3% | 4.38% | 1.8% |
| 30 Year Mortgage | 6/18/26 | 6.47% | 6.36% | 1.7% | 6.81% | -5.0% |
| US Corporate AAA | 6/17/26 | 5.05% | 5.12% | -1.4% | 4.88% | 3.5% |
| US Corporate BBB | 6/17/26 | 5.39% | 5.43% | -0.7% | 5.38% | 0.2% |
| US Corporate CCC | 6/17/26 | 13.65% | 13.55% | 0.7% | 13.07% | 4.4% |
| Effective Fed Funds | 6/17/26 | 3.63% | 3.63% | 0.0% | 4.33% | -16.2% |
US Economy Indicators
| Indicator | As of | Latest | 1 Mo Ago | 1 Mo % | 1 Yr Ago | 1 Yr % |
|---|---|---|---|---|---|---|
| Consumer Sentiment | 5/31/26 | 44.80 | 49.80 | -10.0% | 52.20 | -14.2% |
| Unemployment Rate | 5/31/26 | 4.30% | 4.30% | 0.0% | 4.30% | 0.0% |
| Inflation Rate | 5/31/26 | 4.20% | 3.80% | 10.5% | 2.40% | 75.0% |
| Manufacturing PMI | 5/31/26 | 54.00 | 52.70 | 2.5% | 48.50 | 11.3% |
| Non Manufacturing PMI | 5/31/26 | 54.50 | 53.60 | 1.7% | 49.90 | 9.2% |
| Retail Sales | 5/31/26 | 662,752 | 655,933 | 1.0% | 616,231 | 7.5% |
| Building Permits | 5/31/26 | 1,413 | 1,423 | -0.7% | 1,416 | -0.2% |
Suggested Readings
Leadership Insight
“AI infrastructure demand remained extremely strong, and our full year AI-related revenue outlook is now meaningfully higher than what we laid out just 90 days ago. At the same time, we continue to see better-than-expected performances in areas of the portfolio that have previously been under pressure, including automotive and transportation, and Connected Living and Digital Commerce.”
Stocks to Watch
For our full list of Stocks To Watch, contact Patrick Mullin at pmullin@timberpointcapital.com
In a holiday shortened week, U.S. equity indexes finished higher as progress toward a U.S.-Iran agreement lowered oil prices and supported risk appetite, though hawkish commentary from new Fed Chair Warsh's first meeting produced a sharp midweek reversal. The Nasdaq led with a 2.4% gain, followed by the Russell 2000 at 1.2%, the S&P 500 at 0.9%, and the DJIA at 0.9%.
The Fed held the fed funds target range at 3.50% to 3.75%, as expected, but nine of 18 officials projected at least one rate increase in 2026, with six expecting two or more hikes. 2026 forecasts for headline PCE inflation rose to 3.6% and core PCE to 3.3%. Consumer spending remained resilient highlighted by retail sales rising 0.9% in May, ahead of expectations, while sales excluding autos increased 0.8% and control-group sales advanced 0.7%. Housing remained difficult as the NAHB Housing Market Index fell to 35 and housing starts dropped 15.4% to a 1.177M annual rate, the lowest level since May '20. Building permits came in at 1.413M, roughly flat y/y while pending home sales were stronger, increasing 4.8% y/y, after a 3.8% April increase.
Front-end Treasury yields rose sharply as rate-hike expectations increased, while longer maturities were roughly flat to slightly higher, narrowing the 2-year/10-year spread to about 25 bps, its flattest since early 2025. TIPS breakevens suggest markets expect inflation to return toward 2% over the next two years, perhaps egged on by Chair Warsh's commentary about more work to be done on the inflation front. WTI crude fell 9.7% and traded near $75 as the U.S.-Iran MOU took effect and some energy traffic began moving through the Strait of Hormuz. However, tight inventories and intermittent military activity mean volatility could remain elevated. Natural gas rose 3.6%, gold was essentially flat with a 0.1% gain, and silver declined 3.1%. The USD strengthened following the Fed's hawkish shift, while USD/JPY approached the critical 160 level and renewed intervention speculation.
| Asset Class | 1 Wk | 1 Mo | 3 Mo | YTD | 1 Yr | 3 Yr | 5 Yr |
|---|---|---|---|---|---|---|---|
| S&P 500 | 1.47% | 1.45% | 13.56% | 10.20% | 26.93% | 21.00% | 14.11% |
| Dow Jones Industrials | 1.41% | 4.04% | 12.02% | 8.16% | 24.33% | 16.66% | 11.25% |
| NASDAQ | 2.74% | 1.72% | 19.90% | 14.43% | 36.50% | 25.53% | 14.42% |
| S&P MidCap 400 | 0.58% | 5.35% | 13.11% | 15.41% | 27.15% | 15.43% | 9.41% |
| Russell 2000 | 2.01% | 7.51% | 20.57% | 20.70% | 42.80% | 18.30% | 7.35% |
| Russell Micro Cap | 2.80% | 7.86% | 21.51% | 22.50% | 57.59% | 22.00% | 6.70% |
| Sector | 1Wk | YTD |
|---|---|---|
| 0.74% | -1.69% | |
| 1.81% | -1.69% | |
| 1.15% | 14.75% | |
| -2.36% | 9.42% |
| Sector | 1Wk | YTD |
|---|---|---|
| -2.38% | -6.73% | |
| -5.86% | 21.04% | |
| 3.29% | 16.95% | |
| 4.49% | 33.13% |
| Sector | 1Wk | YTD |
|---|---|---|
| -2.31% | 7.84% | |
| -3.04% | -3.09% | |
| 1.61% | 5.57% |
| Style | 1 Wk | 1 Mo | 3 Mo | YTD | 1 Yr | 3 Yr | 5 Yr |
|---|---|---|---|---|---|---|---|
| Large Growth | 2.22% | 0.00% | 16.19% | 7.19% | 25.04% | 23.80% | 14.18% |
| Large Blend | 1.55% | 1.65% | 13.82% | 10.00% | 26.63% | 21.22% | 13.66% |
| Large Value | 0.66% | 4.41% | 10.66% | 14.02% | 27.84% | 17.74% | 12.67% |
| Mid Growth | 3.83% | 7.83% | 15.71% | 9.91% | 13.26% | 15.64% | 6.81% |
| Mid Blend | 1.36% | 4.59% | 10.96% | 10.89% | 19.56% | 15.60% | 8.44% |
| Mid Value | -0.53% | 2.13% | 7.37% | 11.10% | 23.72% | 15.13% | 9.77% |
| Small Growth | 2.10% | 6.70% | 16.51% | 18.38% | 32.81% | 16.97% | 5.54% |
| Small Blend | 0.73% | 5.41% | 13.41% | 15.45% | 29.98% | 16.28% | 7.84% |
| Small Value | -0.31% | 4.43% | 11.09% | 13.26% | 27.83% | 15.72% | 9.40% |
Fed Chair Warsh's commentary that “persistently high prices are a burden for the American people” and his insistence that the Fed is highly focused on fighting inflation, makes the first PCE price index report (Thur) of his tenure a bit more interesting. Expect a headline 4% print, driven by higher energy/oil prices. The core reading, ex food/energy, will be more enlightening as April's figure of 3.3% was the latest of 5 consecutive monthly increases since November's print of 2.8% - driven by durable goods that are rising at a 3.4% rate owing to trade tariffs and supply chain structures that have turned a historically deflationary force into an inflationary one. Expect increasing odds of a rate hike later in the year, a 180 degree turnaround from rate cuts the market expected Warsh to deliver just a few months ago. US GDP final report (Thur) should be in the mid 3% range, a continued strong showing, led by the AI buildout.
On the earnings front, MU (Wed) is the highlight as it is expected to report blow out rev growth of almost 300% while earnings will approach $20/share, up over 900% y/y. Of course, the go forward commentary will be parsed for any hints of demand weakness or double ordering as well as timing of additional capacity coming on line to help with supply shortages. We will also be focused on CCL and DRI for a read on how consumer spending is holding up for leisure and dining out activities.
Crude oil prices remain on the radar following the US-Iran signing of the MOU - we note that many of the energy related names have pulled back to their 200 dma and remain in uptrends. Given the amout of restocking needed, we believe crude prices will remain in the $70-$80 range, still quite profitable for producers making for a opportunistic entry point.
| Company | Date | EPS Est. |
|---|---|---|
| Carnival Corp. Ltd. (CCL) | Tue Jun 23 | $1.42 |
| Korn Ferry (KFY) | Tue Jun 23 | $1.33 |
| KB Home (KBH) | Tue Jun 23 | $0.88 |
| Worthington Enterprises, Inc. (WOR) | Tue Jun 23 | $1.06 |
| Paychex, Inc. (PAYX) | Wed Jun 24 | $1.31 |
| H.B. Fuller Co. (FUL) | Wed Jun 24 | $1.40 |
| Jefferies Financial Group, Inc. (JEF) | Wed Jun 24 | $0.98 |
| Micron Technology, Inc. (MU) | Wed Jun 24 | $24.37 |
| Acuity, Inc. (AYI) | Thu Jun 25 | $5.53 |
| Darden Restaurants, Inc. (DRI) | Thu Jun 25 | $2.12 |
| Data Release | Date | Est. |
|---|---|---|
| S&P Global Composite PMI Flash | Tue Jun 23 | 50.8 |
| Richmond Fed Manufacturing Index | Tue Jun 23 | 7.0 |
| US New Single Family Houses Sold | Wed Jun 24 | 640K |
| US PCE Price Index YoY | Thu Jun 25 | 4.0% |
| US Durable Goods Excl. Defense New Orders YoY | Thu Jun 25 | -3.9% |
| US GDP | Thu Jun 25 | 3.5% |
| Goods Trade Balance Advanced | Thu Jun 25 | -81.0B |
| US Oil Rig Count | Thu Jun 25 | N/A |
European equities advanced as lower oil prices and progress toward a U.S.-Iran agreement reduced inflation and growth concerns. The STOXX Europe 600 gained 0.6%, Germany's DAX rose 1.6%, France's CAC 40 advanced 1.4%, and Italy's FTSE MIB gained 2.3%, while the FTSE 100 declined 0.7%. The eurozone recorded a EUR 1B trade deficit in April instead of the expected surplus as the energy deficit widened. German wholesale inflation slowed to 5.9% y/y from 6.3%, while the ZEW sentiment index returned to positive territory for the first time since the Middle East war began. The BoE held its base rate at 3.75%, with U.K. inflation steady at 2.8%.
Japan surged, with the Nikkei 225 up 7.6% and the TOPIX gaining 4.8%, led by semiconductor equipment and technology shares tied to global AI investment. The BoJ raised its short-term policy rate by 25 bps to 1.00%, the highest level since 1995, and announced another reduction in monthly JGB purchases. Deputy Governor Uchida delivered a hawkish message highlighting the possibility that underlying inflation could exceed the 2% target. The 10-year JGB yield fell to 2.61%, while the yen weakened to around JPY 160.8 versus USD.
China equities were positive as the CSI 300 rose 3.4% and the Shanghai Composite gained 1.5%. Industrial production increased 4.5% y/y, but retail sales fell 0.6%, the first annual decline since late 2022. Fixed asset investment contracted 4.1% for January through May. Property investment fell 16.2% y/y, although first-tier city home prices rose for a third month. The PBOC announced measures to improve short-term liquidity management but the package fell short of broad stimulus measures. Hong Kong's Hang Seng declined 3.2%.
| Region | 1 Wk | 1 Mo | 3 Mo | YTD | 1 Yr | 3 Yr | 5 Yr |
|---|---|---|---|---|---|---|---|
| MSCI ACWI | 0.59% | 1.02% | 11.05% | 10.60% | 25.79% | 20.64% | 11.35% |
| MSCI ACWI ex USA | 0.67% | 1.62% | 9.66% | 13.30% | 28.38% | 18.89% | 8.33% |
| MSCI Emerging Markets | 0.02% | 1.28% | 15.75% | 23.21% | 45.34% | 22.43% | 7.01% |
| MSCI Europe | 1.88% | 3.59% | 7.68% | 7.34% | 17.83% | 16.77% | 8.75% |
| MSCI Asia Pacific | -0.64% | 0.71% | 13.08% | 20.33% | 38.22% | 20.54% | 7.71% |
| MSCI Latin America | 4.21% | -4.19% | 1.95% | 12.51% | 37.52% | 13.28% | 9.22% |
| Rate | Latest | 1 Mo Ago | 1 Mo % | 1 Yr Ago | 1 Yr % |
|---|---|---|---|---|---|
| 1 Month Treasury | 3.69% | 3.69% | 0.0% | 4.20% | -12.1% |
| 2 Year Treasury | 4.19% | 4.07% | 2.9% | 3.94% | 6.3% |
| 10 Year Treasury | 4.46% | 4.61% | -3.3% | 4.38% | 1.8% |
| 30 Year Mortgage | 6.47% | 6.36% | 1.7% | 6.81% | -5.0% |
| US Corporate AAA | 5.05% | 5.12% | -1.4% | 4.88% | 3.5% |
| US Corporate BBB | 5.39% | 5.43% | -0.7% | 5.38% | 0.2% |
| US Corporate CCC | 13.65% | 13.55% | 0.7% | 13.07% | 4.4% |
| Effective Fed Funds | 3.63% | 3.63% | 0.0% | 4.33% | -16.2% |
| Indicator | Latest | 1 Mo Ago | 1 Mo % | 1 Yr Ago | 1 Yr % |
|---|---|---|---|---|---|
| Consumer Sentiment | 44.80 | 49.80 | -10.0% | 52.20 | -14.2% |
| Unemployment Rate | 4.30% | 4.30% | 0.0% | 4.30% | 0.0% |
| Inflation Rate | 4.20% | 3.80% | 10.5% | 2.40% | 75.0% |
| Manufacturing PMI | 54.00 | 52.70 | 2.5% | 48.50 | 11.3% |
| Non Manufacturing PMI | 54.50 | 53.60 | 1.7% | 49.90 | 9.2% |
| Retail Sales | 662,752 | 655,933 | 1.0% | 616,231 | 7.5% |
| Building Permits | 1,413 | 1,423 | -0.7% | 1,416 | -0.2% |
BFLY has been in an uptrend for the better part of the past year. Recent attempts to break thru the $6 level were met with resistance until last week. We view the price and volume as confirming of an intermediate move higher.
“AI infrastructure demand remained extremely strong, and our full year AI-related revenue outlook is now meaningfully higher than what we laid out just 90 days ago. At the same time, we continue to see better-than-expected performances in areas of the portfolio that have previously been under pressure, including automotive and transportation, and Connected Living and Digital Commerce.”
For our full list of Stocks To Watch, contact Patrick Mullin at pmullin@timberpointcapital.com
©2020 YCharts, Inc. All Rights Reserved. YCharts, Inc. ("YCharts") is not registered with the U.S. Securities and Exchange Commission as an investment adviser, broker-dealer or in any other capacity, and does not purport to provide investment advice or make investment recommendations. This report has been generated through application of the analytical tools and data provided through ycharts.com and is intended solely to assist you or your investment or other adviser(s) in conducting investment research.
All data, statistics and charts are courtesy of YCharts unless otherwise noted. Investment Advice is offered through Fortis Capital Advisors, LLC, 7301 Mission Road, Suite 326, Prairie Village, KS 66208.
While reasonable efforts were used to obtain information from sources believed to be reliable, Fortis Capital Advisors, LLC makes no representation that the information or opinions contained in this material are accurate, reliable, or complete. All information and opinions are subject to change without notice. You should not construe this report as an offer to buy or sell, as a solicitation of an offer to buy or sell, or as a recommendation to buy, sell, hold or trade, any security or other financial instrument.
Past performance is not indicative of future results. Investing involves risk, including the possible loss of principal. The information contained herein is provided for informational purposes only and should not be construed as investment, tax, or legal advice. Recipients should consult their own advisers before making any investment decisions.
Source: Timber Point Capital Management. Powered by Fortis Capital Advisors. Investment Advice is offered through Fortis Capital Advisors, LLC, 7301 Mission Road, Suite 326, Prairie Village, KS 66208. All rights reserved.