
The Week That Was
U.S. equity indexes were mixed as declines in tech/AI shares drove a broad rotation into defensive, value, and smaller-company stocks. The Nasdaq fell 4.6% and the S&P 500 declined 2.0%, while the DJIA gained 0.6% and the Russell 2000 rose 0.4%. The equal-weighted S&P 500 reached another all-time high, highlighting healthier participation. The technology sector (XLK) was lower by more than 5%, which spilled over into similar declines in Large Cap Growth stocks. Technology pressure reflected quarter-end rebalancing, stretched positioning, a 10% one-day decline in South Korea's KOSPI, and concerns about U.S. margin debt which reached a record $1.42T in May. MU reported strong EPS, margins, guidance, and long-term AI memory agreements, but potential margin pressure facing major buyers of high-bandwidth memory spooked investors. Of note, AAPL announced price increases of $200+ for parts of its Mac and iPad lineup.
Headline PCE rose 0.4% m/m in May and accelerated to 4.1% y/y, the highest since April 2023. Core PCE increased 0.3% m/m and 3.4% y/y, the highest annual reading since October 2023, while supercore services inflation was running near 3.9%. Personal income and spending each rose 0.7%, showing continued consumer resilience. First-quarter GDP growth was revised up to 2.1% y/y, from 1.6%, though consumer spending was revised down sharply to 0.5%. The composite PMI rose to 52.2, services increased to 51.3, and manufacturing climbed to 55.7, the highest since May 2022. However, employment declined for a second month and input-price pressure remained elevated. Durable goods orders declined 4.5%, though orders ex-transportation rose 1.3%.
Fixed income rallied on the belief that inflation data may be peaking given the energy sensitive nature of the increase. The 10-year yield declined to about 4.38%, down 10 bps for the week. WTI Crude declined almost 10% to ~$69 per barrel as SoH tanker traffic improved and markets discounted the impact of the supply disruption. Gold declined 2.2%, silver fell 9.3%, and natural gas was unchanged. The USD strengthened on risk aversion.
U.S. Equity Market Summary — As of 6/26/26
| Asset Class | 1 Wk | 1 Mo | 3 Mo | YTD | 1 Yr | 3 Yr | 5 Yr |
|---|---|---|---|---|---|---|---|
| S&P 500 | -1.94% | -2.09% | 13.87% | 8.06% | 21.21% | 20.94% | 13.05% |
| Dow Jones Industrials | 0.60% | 2.99% | 13.34% | 8.82% | 21.57% | 17.56% | 10.63% |
| NASDAQ | -4.60% | -5.03% | 18.35% | 9.18% | 26.21% | 24.65% | 12.82% |
| S&P MidCap 400 | 0.65% | 2.52% | 13.77% | 16.18% | 25.05% | 16.37% | 8.62% |
| Russell 2000 | 1.02% | 3.18% | 21.08% | 21.94% | 40.33% | 19.83% | 6.66% |
| Russell Micro Cap | 1.83% | 2.74% | 22.39% | 24.75% | 55.18% | 24.14% | 6.22% |
U.S. Sector Summary — As of 6/26/26
| Cyclical Sectors | 1 Wk | 1 Mo | 3 Mo | YTD | 1 Yr | 3 Yr | 5 Yr |
|---|---|---|---|---|---|---|---|
| Consumer Cyclical | -2.18% | -4.06% | 5.30% | -3.84% | 7.21% | 12.79% | 6.02% |
| Financials | 0.35% | 3.68% | 9.60% | -1.35% | 5.03% | 19.79% | 9.60% |
| Materials | -0.03% | 1.58% | 5.51% | 14.71% | 19.69% | 10.73% | 6.76% |
| Real Estate | 4.04% | 2.06% | 13.26% | 13.84% | 14.20% | 10.96% | 3.65% |
| Sensitive Sectors | 1 Wk | 1 Mo | 3 Mo | YTD | 1 Yr | 3 Yr | 5 Yr |
|---|---|---|---|---|---|---|---|
| Comm. Services | -2.73% | -7.87% | -2.16% | -9.28% | 1.02% | 20.08% | 6.74% |
| Energy | 0.84% | -6.27% | -11.86% | 22.06% | 29.46% | 14.58% | 18.45% |
| Industrials | 0.41% | 4.21% | 12.63% | 17.42% | 26.27% | 22.01% | 13.80% |
| Technology | -5.28% | -2.06% | 36.85% | 26.10% | 45.02% | 30.18% | 20.96% |
| Defensive Sectors | 1 Wk | 1 Mo | 3 Mo | YTD | 1 Yr | 3 Yr | 5 Yr |
|---|---|---|---|---|---|---|---|
| Consumer Defensive | 2.40% | 2.00% | 5.13% | 10.43% | 8.61% | 7.54% | 6.76% |
| Health Care | 7.79% | 8.44% | 10.50% | 4.46% | 21.54% | 8.70% | 6.70% |
| Utilities | 3.87% | 2.57% | 2.57% | 9.66% | 16.99% | 15.46% | 10.90% |
US Equity Style Summary — As of 6/26/26
| Equity Style | 1 Wk | 1 Mo | 3 Mo | YTD | 1 Yr | 3 Yr | 5 Yr |
|---|---|---|---|---|---|---|---|
| Large Growth | -4.53% | -5.72% | 15.37% | 2.34% | 15.54% | 22.77% | 12.55% |
| Large Blend | -2.08% | -2.06% | 14.01% | 7.71% | 20.76% | 21.12% | 12.57% |
| Large Value | 1.48% | 3.65% | 12.60% | 15.71% | 27.48% | 18.93% | 12.33% |
| Mid Growth | -2.23% | 1.72% | 16.49% | 7.46% | 7.66% | 15.42% | 5.61% |
| Mid Blend | 0.20% | 2.21% | 12.20% | 11.11% | 17.38% | 16.30% | 7.75% |
| Mid Value | 2.12% | 2.57% | 9.07% | 13.46% | 24.55% | 16.54% | 9.49% |
| Small Growth | 0.29% | 1.48% | 18.96% | 18.72% | 30.43% | 18.19% | 4.76% |
| Small Blend | 1.48% | 2.80% | 15.42% | 17.16% | 28.74% | 17.79% | 7.25% |
| Small Value | 2.39% | 3.82% | 12.84% | 15.97% | 27.44% | 17.44% | 8.96% |
International Equity Market Summary — As of 6/26/26
European indexes held up better than Asian markets because of their lower technology concentration. The STOXX Europe 600 was essentially flat, Germany's DAX fell 1.3%, France's CAC 40 declined 0.4%, while the FTSE 100 gained 1.4%. Eurozone inflation expectations eased, with consumers' 12-month outlook falling to 3.5%, the lowest in three months. The flash Eurozone composite PMI improved to 49.5 from 48.5, but remained below the 50 expansion threshold, while manufacturing PMI held in expansion at 51.3. Germany's composite PMI fell to 48.0, signaling a third straight month of declining private-sector activity. In the U.K., Prime Minister Keir Starmer resigned, while retail sales and manufacturing orders weakened sharply amid soft confidence and rising prices.
Japan declined as AI-related stocks reversed late in the week, ending with declines. The Nikkei 225 fell 2.7% and TOPIX declined 2.0%. Lower oil prices supported JGB demand and helped the 10-year yield fall to 2.60% from 2.64%. Tokyo core inflation accelerated to 1.6% y/y from 1.3%, reinforcing expectations for additional BoJ tightening, while the yen weakened toward the upper JPY 161 range versus USD. The government also announced a JPY 370T public-private investment plan through 2040 focused on AI, semiconductors, and other strategic sectors.
China equities also fell on the broader technology selloff with the CSI 300 down 1.5% and the Shanghai Composite falling 1.6%. Premier Li Qiang reiterated Beijing's commitment to innovation, advanced manufacturing, and further economic opening. Hong Kong's Hang Seng declined 5.2% as technology and financials came under pressure.
| Region | 1 Wk | 1 Mo | 3 Mo | YTD | 1 Yr | 3 Yr | 5 Yr |
|---|---|---|---|---|---|---|---|
| MSCI ACWI | -2.07% | -1.54% | 13.22% | 9.69% | 23.30% | 20.47% | 11.07% |
| MSCI ACWI ex USA | -2.23% | -0.65% | 11.91% | 12.64% | 27.28% | 18.96% | 8.34% |
| MSCI Emerging Markets | -4.44% | -0.56% | 18.52% | 22.61% | 41.70% | 22.70% | 6.92% |
| MSCI Europe | -0.53% | -0.33% | 9.80% | 6.35% | 18.14% | 16.44% | 8.79% |
| MSCI Asia Pacific | -4.05% | -0.39% | 15.96% | 20.37% | 36.31% | 21.24% | 7.77% |
| MSCI Latin America | -0.12% | -3.31% | -0.80% | 10.93% | 33.90% | 12.13% | 8.70% |
Chart of the Week — 6/29/26
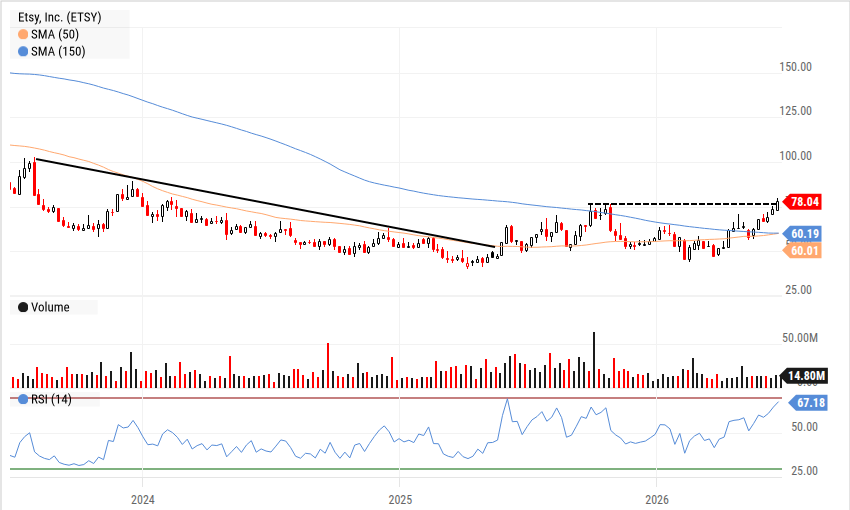
ETSY broke a multi-year downtrend in mid 2025 and has recently broken through an intermediate high in the mid $70 range. If the market continues to broaden out and consumer discretionary can catch a bid, we think ETSY can move higher from here with a near/mid target in the low $90's.
The Week Ahead
The last two trading days of 2Q26 have arrived and the market is trying to determine if the rotation from technology is a quarter end phenomenon or a more durable shift for investors taking chips, pardon the pun, off the table. This week will test new Fed Chair Warsh's comment at his first FOMC meeting that policymakers “felt good about the labor market” as there is a slew of data including ADP (Wed) and non-farm payrolls (Thur), both of which are expected to support Warsh's assessment despite fears of AI-related layoffs.
JOLTS data (Tue) will be watched closely for job openings which posted a 2-year high north of 8M in April, a level far higher than expected, while job quits dropped to the lowest level in the last five years. Challenger job cuts (Wed) have been rising over the past few months but have remained below the psychological 100K level and below the difficult print of 153K in October. ISM Manufacturing PMI (Wed) has been posting expansionary numbers (+50.0) for all of 2026 after having been in contraction territory for several years — no doubt a function of the AI-related infrastructure buildout.
On the earnings front, the focus of the week will be NKE (Tues) as it attempts to get its mojo back with its “Win Now” turnaround strategy focused on product innovation and streamlined distribution, in addition to “adjusting” prices in China to help revive sales growth there. STZ and GIS have been difficult stocks for the past year plus and both will hope to revive revenue growth while managing cost input pressures. Finally, Fed Chair Warsh will kick off 3Q26 with comments at the ECB Forum on Central Banking in Portugal.
| Company | Date | EPS Est. |
|---|---|---|
| AeroVironment, Inc. (AVAV) | Mon Jun 29 | $0.78 |
| Concentrix Corp. (CNXC) | Mon Jun 29 | $3.09 |
| NIKE, Inc. (NKE) | Tue Jun 30 | $0.45 |
| Progress Software Corp. (PRGS) | Tue Jun 30 | $1.49 |
| Constellation Brands, Inc. (STZ) | Tue Jun 30 | $3.70 |
| FactSet Research Systems, Inc. (FDS) | Wed Jul 1 | $4.32 |
| General Mills, Inc. (GIS) | Wed Jul 1 | $0.79 |
| MSC Industrial Direct Co., Inc. (MSM) | Wed Jul 1 | $1.27 |
| Greenbrier Cos., Inc. (GBX) | Wed Jul 1 | $0.90 |
| Lindsay Corp. (LNN) | Thu Jul 2 | $1.18 |
| Data Release | Date | Est. |
|---|---|---|
| Case-Shiller Composite 20 Home Price Index YoY | Tue Jun 30 | 0.8% |
| US Job Openings: Total Nonfarm | Tue Jun 30 | 7.4M |
| Conference Board Consumer Confidence | Tue Jun 30 | 94.0 |
| US Challenger Job Cuts | Wed Jul 1 | 85.0K |
| ADP Employment Change | Wed Jul 1 | 105.0K |
| Fed Chair Warsh Speech | Wed Jul 1 | N/A |
| US ISM Manufacturing PMI | Wed Jul 1 | N/A |
| US Total Nonfarm Payrolls | Thu Jul 2 | 110.0K |
Key Interest Rates — As of 6/26/26
| Rate | As of | Latest | 1 Mo Ago | 1 Mo % | 1 Yr Ago | 1 Yr % |
|---|---|---|---|---|---|---|
| 1 Month Treasury | 6/26/26 | 3.70% | 3.72% | -0.5% | 4.11% | -10.0% |
| 2 Year Treasury | 6/26/26 | 4.07% | 4.01% | 1.5% | 3.70% | 10.0% |
| 10 Year Treasury | 6/26/26 | 4.38% | 4.50% | -2.7% | 4.26% | 2.8% |
| 30 Year Mortgage | 6/25/26 | 6.49% | 6.51% | -0.3% | N/A | N/A |
| US Corporate AAA | 6/25/26 | 4.99% | 5.07% | -1.6% | 4.80% | 4.0% |
| US Corporate BBB | 6/25/26 | 5.31% | 5.39% | -1.5% | 5.28% | 0.6% |
| US Corporate CCC | 6/25/26 | 13.83% | 13.59% | 1.8% | 12.74% | 8.6% |
| Effective Fed Funds | 6/25/26 | 3.63% | 3.62% | 0.3% | 4.33% | -16.2% |
US Economy Indicators
| Indicator | As of | Latest | 1 Mo Ago | 1 Mo % | 1 Yr Ago | 1 Yr % |
|---|---|---|---|---|---|---|
| Consumer Sentiment | 5/31/26 | 44.80 | 49.80 | -10.0% | 52.20 | -14.2% |
| Unemployment Rate | 5/31/26 | 4.30% | 4.30% | 0.0% | 4.30% | 0.0% |
| Inflation Rate | 5/31/26 | 4.20% | 3.80% | 10.5% | 2.40% | 75.0% |
| Manufacturing PMI | 5/31/26 | 54.00 | 52.70 | 2.5% | 48.50 | 11.3% |
| Non Manufacturing PMI | 5/31/26 | 54.50 | 53.60 | 1.7% | 49.90 | 9.2% |
| Retail Sales | 5/31/26 | 662,752 | 655,933 | 1.0% | 616,231 | 7.5% |
| Building Permits | 5/31/26 | 1,413 | 1,423 | -0.7% | 1,416 | -0.2% |
Suggested Readings
- 1Iran War Update, Special Report — June 28, 2026
- 2In Memory of Alan Greenspan: A Speech at the Adam Smith Memorial Lecture; February, 2005
- 3DoE Offers $17.5B in Loans to Help Build 10 Large Nuclear Reactors
- 4Satya Nadella Recognizes the Hypocrisy in Tech's AI Strategy
- 5Behind-the-Meter AI: Chevron Lands 20-Year Microsoft Deal to Power West Texas AI Campus
Leadership Insight
“We plan to see decreasing hardware revenue for the next few quarters as our existing POs are delivered and our mix shifts towards the majority of our hardware production being deployed in Cerebras Cloud to fulfill our significant contracts. This trend could change relatively quickly, however, as OpenAI and AWS as well as other customers make decisions about when and how they prefer to deploy our hardware solutions in our data centers or theirs.”
Stocks to Watch
For our full list of Stocks To Watch, contact Patrick Mullin at pmullin@timberpointcapital.com
U.S. equity indexes were mixed as declines in tech/AI shares drove a broad rotation into defensive, value, and smaller-company stocks. The Nasdaq fell 4.6% and the S&P 500 declined 2.0%, while the DJIA gained 0.6% and the Russell 2000 rose 0.4%. The equal-weighted S&P 500 reached another all-time high, highlighting healthier participation. The technology sector (XLK) was lower by more than 5%, which spilled over into similar declines in Large Cap Growth stocks. Technology pressure reflected quarter-end rebalancing, stretched positioning, a 10% one-day decline in South Korea's KOSPI, and concerns about U.S. margin debt which reached a record $1.42T in May. MU reported strong EPS, margins, guidance, and long-term AI memory agreements, but potential margin pressure facing major buyers of high-bandwidth memory spooked investors. Of note, AAPL announced price increases of $200+ for parts of its Mac and iPad lineup.
Headline PCE rose 0.4% m/m in May and accelerated to 4.1% y/y, the highest since April 2023. Core PCE increased 0.3% m/m and 3.4% y/y, the highest annual reading since October 2023, while supercore services inflation was running near 3.9%. Personal income and spending each rose 0.7%, showing continued consumer resilience. First-quarter GDP growth was revised up to 2.1% y/y, from 1.6%, though consumer spending was revised down sharply to 0.5%. The composite PMI rose to 52.2, services increased to 51.3, and manufacturing climbed to 55.7, the highest since May 2022. However, employment declined for a second month and input-price pressure remained elevated. Durable goods orders declined 4.5%, though orders ex-transportation rose 1.3%.
Fixed income rallied on the belief that inflation data may be peaking given the energy sensitive nature of the increase. The 10-year yield declined to about 4.38%, down 10 bps for the week. WTI Crude declined almost 10% to ~$69 per barrel as SoH tanker traffic improved and markets discounted the impact of the supply disruption. Gold declined 2.2%, silver fell 9.3%, and natural gas was unchanged. The USD strengthened on risk aversion.
| Asset Class | 1 Wk | 1 Mo | 3 Mo | YTD | 1 Yr | 3 Yr | 5 Yr |
|---|---|---|---|---|---|---|---|
| S&P 500 | -1.94% | -2.09% | 13.87% | 8.06% | 21.21% | 20.94% | 13.05% |
| Dow Jones Industrials | 0.60% | 2.99% | 13.34% | 8.82% | 21.57% | 17.56% | 10.63% |
| NASDAQ | -4.60% | -5.03% | 18.35% | 9.18% | 26.21% | 24.65% | 12.82% |
| S&P MidCap 400 | 0.65% | 2.52% | 13.77% | 16.18% | 25.05% | 16.37% | 8.62% |
| Russell 2000 | 1.02% | 3.18% | 21.08% | 21.94% | 40.33% | 19.83% | 6.66% |
| Russell Micro Cap | 1.83% | 2.74% | 22.39% | 24.75% | 55.18% | 24.14% | 6.22% |
| Sector | 1Wk | YTD |
|---|---|---|
| -2.18% | -3.84% | |
| 0.35% | -1.35% | |
| -0.03% | 14.71% | |
| 4.04% | 13.84% |
| Sector | 1Wk | YTD |
|---|---|---|
| -2.73% | -9.28% | |
| 0.84% | 22.06% | |
| 0.41% | 17.42% | |
| -5.28% | 26.10% |
| Sector | 1Wk | YTD |
|---|---|---|
| 2.40% | 10.43% | |
| 7.79% | 4.46% | |
| 3.87% | 9.66% |
| Style | 1 Wk | 1 Mo | 3 Mo | YTD | 1 Yr | 3 Yr | 5 Yr |
|---|---|---|---|---|---|---|---|
| Large Growth | -4.53% | -5.72% | 15.37% | 2.34% | 15.54% | 22.77% | 12.55% |
| Large Blend | -2.08% | -2.06% | 14.01% | 7.71% | 20.76% | 21.12% | 12.57% |
| Large Value | 1.48% | 3.65% | 12.60% | 15.71% | 27.48% | 18.93% | 12.33% |
| Mid Growth | -2.23% | 1.72% | 16.49% | 7.46% | 7.66% | 15.42% | 5.61% |
| Mid Blend | 0.20% | 2.21% | 12.20% | 11.11% | 17.38% | 16.30% | 7.75% |
| Mid Value | 2.12% | 2.57% | 9.07% | 13.46% | 24.55% | 16.54% | 9.49% |
| Small Growth | 0.29% | 1.48% | 18.96% | 18.72% | 30.43% | 18.19% | 4.76% |
| Small Blend | 1.48% | 2.80% | 15.42% | 17.16% | 28.74% | 17.79% | 7.25% |
| Small Value | 2.39% | 3.82% | 12.84% | 15.97% | 27.44% | 17.44% | 8.96% |
The last two trading days of 2Q26 have arrived and the market is trying to determine if the rotation from technology is a quarter end phenomenon or a more durable shift for investors taking chips, pardon the pun, off the table. This week will test new Fed Chair Warsh's comment at his first FOMC meeting that policymakers “felt good about the labor market” as there is a slew of data including ADP (Wed) and non-farm payrolls (Thur), both of which are expected to support Warsh's assessment despite fears of AI-related layoffs.
JOLTS data (Tue) will be watched closely for job openings which posted a 2-year high north of 8M in April, a level far higher than expected, while job quits dropped to the lowest level in the last five years. Challenger job cuts (Wed) have been rising over the past few months but have remained below the psychological 100K level and below the difficult print of 153K in October. ISM Manufacturing PMI (Wed) has been posting expansionary numbers (+50.0) for all of 2026 after having been in contraction territory for several years — no doubt a function of the AI-related infrastructure buildout.
On the earnings front, the focus of the week will be NKE (Tues) as it attempts to get its mojo back with its “Win Now” turnaround strategy focused on product innovation and streamlined distribution, in addition to “adjusting” prices in China to help revive sales growth there. STZ and GIS have been difficult stocks for the past year plus and both will hope to revive revenue growth while managing cost input pressures. Finally, Fed Chair Warsh will kick off 3Q26 with comments at the ECB Forum on Central Banking in Portugal.
| Company | Date | EPS Est. |
|---|---|---|
| AeroVironment, Inc. (AVAV) | Mon Jun 29 | $0.78 |
| Concentrix Corp. (CNXC) | Mon Jun 29 | $3.09 |
| NIKE, Inc. (NKE) | Tue Jun 30 | $0.45 |
| Progress Software Corp. (PRGS) | Tue Jun 30 | $1.49 |
| Constellation Brands, Inc. (STZ) | Tue Jun 30 | $3.70 |
| FactSet Research Systems, Inc. (FDS) | Wed Jul 1 | $4.32 |
| General Mills, Inc. (GIS) | Wed Jul 1 | $0.79 |
| MSC Industrial Direct Co., Inc. (MSM) | Wed Jul 1 | $1.27 |
| Greenbrier Cos., Inc. (GBX) | Wed Jul 1 | $0.90 |
| Lindsay Corp. (LNN) | Thu Jul 2 | $1.18 |
| Data Release | Date | Est. |
|---|---|---|
| Case-Shiller Composite 20 Home Price Index YoY | Tue Jun 30 | 0.8% |
| US Job Openings: Total Nonfarm | Tue Jun 30 | 7.4M |
| Conference Board Consumer Confidence | Tue Jun 30 | 94.0 |
| US Challenger Job Cuts | Wed Jul 1 | 85.0K |
| ADP Employment Change | Wed Jul 1 | 105.0K |
| Fed Chair Warsh Speech | Wed Jul 1 | N/A |
| US ISM Manufacturing PMI | Wed Jul 1 | N/A |
| US Total Nonfarm Payrolls | Thu Jul 2 | 110.0K |
European indexes held up better than Asian markets because of their lower technology concentration. The STOXX Europe 600 was essentially flat, Germany's DAX fell 1.3%, France's CAC 40 declined 0.4%, while the FTSE 100 gained 1.4%. Eurozone inflation expectations eased, with consumers' 12-month outlook falling to 3.5%, the lowest in three months. The flash Eurozone composite PMI improved to 49.5 from 48.5, but remained below the 50 expansion threshold, while manufacturing PMI held in expansion at 51.3. Germany's composite PMI fell to 48.0, signaling a third straight month of declining private-sector activity. In the U.K., Prime Minister Keir Starmer resigned, while retail sales and manufacturing orders weakened sharply amid soft confidence and rising prices.
Japan declined as AI-related stocks reversed late in the week, ending with declines. The Nikkei 225 fell 2.7% and TOPIX declined 2.0%. Lower oil prices supported JGB demand and helped the 10-year yield fall to 2.60% from 2.64%. Tokyo core inflation accelerated to 1.6% y/y from 1.3%, reinforcing expectations for additional BoJ tightening, while the yen weakened toward the upper JPY 161 range versus USD. The government also announced a JPY 370T public-private investment plan through 2040 focused on AI, semiconductors, and other strategic sectors.
China equities also fell on the broader technology selloff with the CSI 300 down 1.5% and the Shanghai Composite falling 1.6%. Premier Li Qiang reiterated Beijing's commitment to innovation, advanced manufacturing, and further economic opening. Hong Kong's Hang Seng declined 5.2% as technology and financials came under pressure.
| Region | 1 Wk | 1 Mo | 3 Mo | YTD | 1 Yr | 3 Yr | 5 Yr |
|---|---|---|---|---|---|---|---|
| MSCI ACWI | -2.07% | -1.54% | 13.22% | 9.69% | 23.30% | 20.47% | 11.07% |
| MSCI ACWI ex USA | -2.23% | -0.65% | 11.91% | 12.64% | 27.28% | 18.96% | 8.34% |
| MSCI Emerging Markets | -4.44% | -0.56% | 18.52% | 22.61% | 41.70% | 22.70% | 6.92% |
| MSCI Europe | -0.53% | -0.33% | 9.80% | 6.35% | 18.14% | 16.44% | 8.79% |
| MSCI Asia Pacific | -4.05% | -0.39% | 15.96% | 20.37% | 36.31% | 21.24% | 7.77% |
| MSCI Latin America | -0.12% | -3.31% | -0.80% | 10.93% | 33.90% | 12.13% | 8.70% |
| Rate | Latest | 1 Mo Ago | 1 Mo % | 1 Yr Ago | 1 Yr % |
|---|---|---|---|---|---|
| 1 Month Treasury | 3.70% | 3.72% | -0.5% | 4.11% | -10.0% |
| 2 Year Treasury | 4.07% | 4.01% | 1.5% | 3.70% | 10.0% |
| 10 Year Treasury | 4.38% | 4.50% | -2.7% | 4.26% | 2.8% |
| 30 Year Mortgage | 6.49% | 6.51% | -0.3% | N/A | N/A |
| US Corporate AAA | 4.99% | 5.07% | -1.6% | 4.80% | 4.0% |
| US Corporate BBB | 5.31% | 5.39% | -1.5% | 5.28% | 0.6% |
| US Corporate CCC | 13.83% | 13.59% | 1.8% | 12.74% | 8.6% |
| Effective Fed Funds | 3.63% | 3.62% | 0.3% | 4.33% | -16.2% |
| Indicator | Latest | 1 Mo Ago | 1 Mo % | 1 Yr Ago | 1 Yr % |
|---|---|---|---|---|---|
| Consumer Sentiment | 44.80 | 49.80 | -10.0% | 52.20 | -14.2% |
| Unemployment Rate | 4.30% | 4.30% | 0.0% | 4.30% | 0.0% |
| Inflation Rate | 4.20% | 3.80% | 10.5% | 2.40% | 75.0% |
| Manufacturing PMI | 54.00 | 52.70 | 2.5% | 48.50 | 11.3% |
| Non Manufacturing PMI | 54.50 | 53.60 | 1.7% | 49.90 | 9.2% |
| Retail Sales | 662,752 | 655,933 | 1.0% | 616,231 | 7.5% |
| Building Permits | 1,413 | 1,423 | -0.7% | 1,416 | -0.2% |
ETSY broke a multi-year downtrend in mid 2025 and has recently broken through an intermediate high in the mid $70 range. If the market continues to broaden out and consumer discretionary can catch a bid, we think ETSY can move higher from here with a near/mid target in the low $90's.
“We plan to see decreasing hardware revenue for the next few quarters as our existing POs are delivered and our mix shifts towards the majority of our hardware production being deployed in Cerebras Cloud to fulfill our significant contracts. This trend could change relatively quickly, however, as OpenAI and AWS as well as other customers make decisions about when and how they prefer to deploy our hardware solutions in our data centers or theirs.”
For our full list of Stocks To Watch, contact Patrick Mullin at pmullin@timberpointcapital.com
©2020 YCharts, Inc. All Rights Reserved. YCharts, Inc. ("YCharts") is not registered with the U.S. Securities and Exchange Commission as an investment adviser, broker-dealer or in any other capacity, and does not purport to provide investment advice or make investment recommendations. This report has been generated through application of the analytical tools and data provided through ycharts.com and is intended solely to assist you or your investment or other adviser(s) in conducting investment research.
All data, statistics and charts are courtesy of YCharts unless otherwise noted. Investment Advice is offered through Fortis Capital Advisors, LLC, 7301 Mission Road, Suite 326, Prairie Village, KS 66208.
While reasonable efforts were used to obtain information from sources believed to be reliable, Fortis Capital Advisors, LLC makes no representation that the information or opinions contained in this material are accurate, reliable, or complete. All information and opinions are subject to change without notice. You should not construe this report as an offer to buy or sell, as a solicitation of an offer to buy or sell, or as a recommendation to buy, sell, hold or trade, any security or other financial instrument.
Past performance is not indicative of future results. Investing involves risk, including the possible loss of principal. The information contained herein is provided for informational purposes only and should not be construed as investment, tax, or legal advice. Recipients should consult their own advisers before making any investment decisions.
Source: Timber Point Capital Management. Powered by Fortis Capital Advisors. Investment Advice is offered through Fortis Capital Advisors, LLC, 7301 Mission Road, Suite 326, Prairie Village, KS 66208. All rights reserved.