
The Week That Was
U.S. equity indexes were mixed as investors considered renewed U.S.-Iran tensions and higher oil prices along with the start of 2Q26 earnings season. The Nasdaq led with a 1.7% gain and the S&P 500 rose 1.2%, while the DJIA declined 0.5% and the Russell 2000 fell 0.6%. Growth outperformed value, with information technology, energy, and communication services leading within the S&P 500, while materials and health care lagged. PEP reported earnings that suggested continued challenges with NAM results amid higher input costs that will result in continued SKU rationalization and ongoing cost efficiency measures. The economic calendar was light, but the FOMC minutes leaned hawkish as it showed policymakers were divided between holding rates steady and raising rates later this year, with some officials seeing enough evidence to hike at the June meeting. ISM services eased to 54.0 in June from 54.5 in May but remained expansionary, while the prices index declined to 67.7, still pointing to persistent cost pressures. S&P Global services PMI rose to 51.2, existing home sales fell to a 4.09M annual rate, initial jobless claims slipped to 215K, and continuing claims rose to 1.81M.
Rising oil prices and the more hawkish Fed backdrop pushed yields higher with the 10-year Treasury yield rising to 4.56% from 4.49% the prior week and 30-year yields rose 7 bp's to just shy of 5%. Market-implied odds of a July Fed hike rose to about 31% from 17%, while September hike odds increased to about 84% from 61%. Auctions for the 3-year, 10-year, and 30-year Treasuries were well received, with all three stopping through, a sign that demand for duration remains healthy even as supply concerns linger. WTI crude rose 4.2% and moved back above $70 per barrel as renewed U.S.-Iran hostilities and shipping disruptions in the SoH revived supply concerns, though late-week negotiations helped oil trim gains. Natural gas fell 7.9%, gold declined 1.9%, and silver dropped 4.6%. The USD index was unchanged while the yen continued weak.
U.S. Equity Market Summary — As of 7/10/26
| Asset Class | 1 Wk | 1 Mo | 3 Mo | YTD | 1 Yr | 3 Yr | 5 Yr |
|---|---|---|---|---|---|---|---|
| S&P 500 | 1.26% | 4.34% | 11.44% | 11.36% | 22.07% | 21.39% | 13.25% |
| Dow Jones Industrials Average | -0.50% | 5.54% | 10.29% | 10.46% | 19.85% | 17.86% | 10.67% |
| NASDAQ | 1.74% | 4.46% | 14.92% | 13.44% | 28.17% | 25.16% | 13.15% |
| S&P MidCap 400 | -0.60% | 2.98% | 7.65% | 15.16% | 19.80% | 14.49% | 8.57% |
| Russell 2000 | -0.61% | 5.14% | 13.52% | 20.71% | 33.20% | 17.86% | 6.94% |
| Russell Micro Cap | -1.14% | 8.22% | 15.91% | 24.61% | 47.40% | 22.81% | 7.01% |
U.S. Sector Summary — As of 7/10/26
| Cyclical Sectors | 1 Wk | 1 Mo | 3 Mo | YTD | 1 Yr | 3 Yr | 5 Yr |
|---|---|---|---|---|---|---|---|
| Consumer Cyclical | 0.10% | 3.51% | 4.06% | -1.43% | 6.74% | 12.24% | 6.01% |
| Financials | 0.16% | 7.03% | 10.11% | 2.59% | 7.32% | 20.07% | 10.59% |
| Materials | -2.15% | 2.98% | -1.69% | 13.13% | 12.30% | 9.89% | 6.25% |
| Real Estate | -0.51% | -0.34% | 4.71% | 11.86% | 10.48% | 9.08% | 2.73% |
| Sensitive Sectors | 1 Wk | 1 Mo | 3 Mo | YTD | 1 Yr | 3 Yr | 5 Yr |
|---|---|---|---|---|---|---|---|
| Comm. Services | 1.86% | 0.83% | -1.77% | -4.61% | 5.95% | 21.18% | 7.56% |
| Energy | 3.49% | -4.77% | -2.58% | 24.87% | 27.99% | 14.18% | 20.09% |
| Industrials | -1.08% | 7.49% | 6.32% | 17.89% | 22.23% | 20.81% | 13.64% |
| Technology | 2.87% | 5.31% | 30.42% | 29.35% | 45.34% | 30.21% | 20.60% |
| Defensive Sectors | 1 Wk | 1 Mo | 3 Mo | YTD | 1 Yr | 3 Yr | 5 Yr |
|---|---|---|---|---|---|---|---|
| Consumer Defensive | -1.02% | -0.92% | 2.84% | 9.66% | 6.60% | 7.51% | 6.47% |
| Health Care | -1.77% | 5.69% | 9.66% | 4.78% | 20.04% | 9.16% | 6.26% |
| Utilities | -0.76% | 3.86% | -2.69% | 7.79% | 13.04% | 15.12% | 10.31% |
US Equity Style Summary — As of 7/10/26
| Equity Style | 1 Wk | 1 Mo | 3 Mo | YTD | 1 Yr | 3 Yr | 5 Yr |
|---|---|---|---|---|---|---|---|
| Large Growth | 2.09% | 4.59% | 13.82% | 7.71% | 19.06% | 23.91% | 12.98% |
| Large Blend | 1.31% | 4.39% | 11.72% | 11.11% | 21.82% | 21.59% | 12.81% |
| Large Value | 0.13% | 4.17% | 9.46% | 16.02% | 24.80% | 18.46% | 12.27% |
| Mid Growth | 0.36% | 5.43% | 12.87% | 8.69% | 6.64% | 14.44% | 5.59% |
| Mid Blend | 0.49% | 4.63% | 9.50% | 12.37% | 15.63% | 15.36% | 7.88% |
| Mid Value | 0.58% | 4.00% | 7.01% | 14.73% | 22.18% | 15.64% | 9.78% |
| Small Growth | -1.21% | 4.70% | 12.21% | 17.49% | 25.62% | 15.96% | 4.68% |
| Small Blend | -0.82% | 4.13% | 9.88% | 16.34% | 23.35% | 15.87% | 7.36% |
| Small Value | -0.54% | 3.67% | 8.14% | 15.45% | 21.63% | 15.75% | 9.22% |
International Equity Market Summary — As of 7/10/26
European equities pulled back from record highs as geopolitical tensions and higher crude prices raised concerns about inflation and additional central bank tightening. The STOXX Europe 600 fell 1.8%, Germany's DAX declined 2.8%, France's CAC 40 dropped 2.0% and the FTSE 100 lost 1.7%. Germany's annual inflation rate moderated to 2.3% in June from 2.6%, while higher German exports pointed to pockets of resilience beneath the risk-off tone. In the U.K., political developments remained in focus as Andy Burnham secured broad parliamentary backing to succeed Keir Starmer as Labour leader. Housing data stayed soft, with buyer inquiries and agreed sales still negative despite modest improvement.
Japan declined as higher oil as the Nikkei 225 fell 1.7% and TOPIX declined 0.7%. The 10-year JGB yield ended near 2.78%, little changed for the week after briefly reaching its highest level since 1996. Producer prices rose 7.1% y/y in June, above expectations, while nominal wages increased 3.2% y/y and real wages rose 1.4%, down from the prior month. Household spending fell 0.4% y/y, a smaller decline than expected, suggesting consumer demand remained more resilient than feared. The yen strengthened back into the JPY 161 range versus the USD after earlier weakness.
China equities followed suit as the CSI 300 fell 1.3% and the Shanghai Composite declined 1.2%. June CPI rose 1.0% y/y and core CPI edged down to 1.0%, while producer prices increased 4.1% y/y, the fastest since July 2022. The PBOC maintained an accommodative policy tone, pledging ample liquidity and targeted support for domestic demand though stopping short of announcing broad stimulus. Hong Kong's Hang Seng rose by 3.5%.
| Region | 1 Wk | 1 Mo | 3 Mo | YTD | 1 Yr | 3 Yr | 5 Yr |
|---|---|---|---|---|---|---|---|
| MSCI ACWI | 0.24% | 3.78% | 9.42% | 12.15% | 23.71% | 20.90% | 11.49% |
| MSCI ACWI ex USA | -1.31% | 2.61% | 5.57% | 13.39% | 26.63% | 19.33% | 8.95% |
| MSCI Emerging Markets | -1.74% | 1.74% | 9.97% | 21.70% | 39.82% | 22.52% | 7.69% |
| MSCI Europe Stock | -1.90% | 2.85% | 3.05% | 7.55% | 16.41% | 17.01% | 9.21% |
| MSCI Asia Pacific Stock | -1.41% | 2.46% | 9.77% | 20.44% | 36.59% | 21.38% | 8.51% |
| MSCI Latin America Stock | 1.91% | 6.10% | -8.10% | 13.61% | 38.23% | 13.35% | 10.49% |
Chart of the Week — 7/13/26
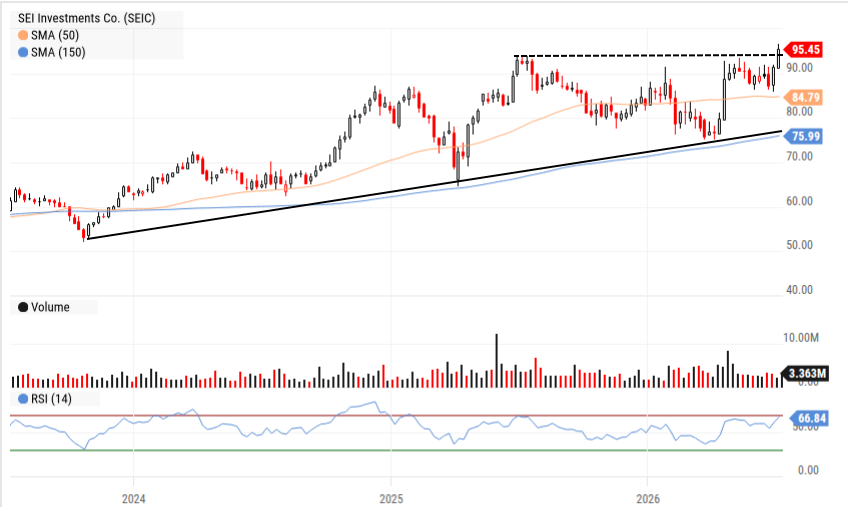
SEIC has been in a solid uptrend for the better part of 2 years and has recently broken above old highs going back to mid '25. Many financial stocks have been putting in multiple new highs over the course of '26 - we think SEIC could just be getting started.
The Week Ahead
Buckle up...2Q26 earnings season is here and will be led by the major financials. YTD, financials (XLF) are the 3rd worst performing SPDR sector, but they have had a nice run over the past month with gains of 7% and they also outpaced all other R1K sectors this past week with 28 companies on the new high list. Investors wouldn't be so quick to rush to financials if they believed that the economy was slowing (dramatically, Atlanta Fed now at 1.3% for 2Q26) or in jeopardy of entering a period of credit deterioration. We believe that banks will set a relatively optimistic foundation for the balance of earnings to follow in subsequent weeks.
NFLX (Thur) has confused investors with its now scuttled acquisition of WBD and subsequent rumors of interest in LION. With the stock probing multi-year lows, management needs to convince investors of its organic growth opportunities. GE (Thur) is near recent highs and demand is solid but investors were spooked in 1Q26 by management's guidance for sluggish global departures owing to a low double digit decline in Middle East departures. Has that outlook changed?
June CPI (Tues) is expected to decline to sub 4% after hitting 4.2% in May, driven by higher energy prices. It was only Jan/Feb '26 that headline CPI was at 2.4%, and two rate cuts were expected. Retail sales (Thur) have continued to benefit from increases in inflation, clocking in at 6.9% y/y in May, the steepest yearly increase since Jan '23. US industrial production (Fri) likely continues its positive ways, up 1.7% y/y in May, after flatlining for much of '23 and '24 as AI infrastructure, commercial aircraft demand and factory automation lead the way.
| Company | Date | EPS Est. |
|---|---|---|
| Bank of America Corp. (BAC) | Tue Jul 14 | $1.15 |
| Citigroup, Inc. (C) | Tue Jul 14 | $2.69 |
| Fastenal Co. (FAST) | Tue Jul 14 | $0.33 |
| The Goldman Sachs Group, Inc. (GS) | Tue Jul 14 | $14.18 |
| JPMorgan Chase & Co. (JPM) | Tue Jul 14 | $5.48 |
| Wells Fargo & Co. (WFC) | Tue Jul 14 | $1.83 |
| BlackRock, Inc. (BLK) | Wed Jul 15 | $13.97 |
| Johnson & Johnson (JNJ) | Wed Jul 15 | $3.03 |
| Morgan Stanley (MS) | Wed Jul 15 | $2.95 |
| United Airlines Holdings, Inc. (UAL) | Wed Jul 15 | $3.45 |
| GE Aerospace (GE) | Thu Jul 16 | $1.91 |
| Netflix, Inc. (NFLX) | Thu Jul 16 | $0.84 |
| UnitedHealth Group, Inc. (UNH) | Thu Jul 16 | $3.74 |
| Data Release | Date | Est. |
|---|---|---|
| Small Business Optimism Index | Tue Jul 14 | 96.0 |
| US Consumer Price Index YoY | Tue Jul 14 | 3.9% |
| Fed Chair Warsh Testimony | Tue Jul 14 | N/A |
| US Producer Price Index YoY | Wed Jul 15 | 6.30% |
| Empire State Manufacturing Index | Wed Jul 15 | 6.20 |
| US Retail Sales YoY | Thu Jul 16 | 6.7% |
| Philly Fed Manufacturing Activity | Thu Jul 16 | 11.0 |
| US Pending Home Sales YoY | Thu Jul 16 | 2.3% |
| US Housing Starts | Thu Jul 16 | 1.2M |
| US Industrial Production YoY | Fri Jul 17 | 1.5% |
| US Index of Consumer Sentiment | Fri Jul 17 | 50.4 |
Key Interest Rates — As of 7/10/26
| Rate | As of | Latest | 1 Mo Ago | 1 Mo % | 1 Yr Ago | 1 Yr % |
|---|---|---|---|---|---|---|
| 1 Month Treasury | 7/10/26 | 3.71% | 3.69% | 0.5% | 4.36% | -14.9% |
| 2 Year Treasury | 7/10/26 | 4.21% | 4.13% | 1.9% | 3.86% | 9.1% |
| 10 Year Treasury | 7/10/26 | 4.56% | 4.55% | 0.2% | 4.35% | 4.8% |
| 30 Year Mortgage | 7/9/26 | 6.49% | 6.48% | 0.2% | 6.67% | -2.7% |
| US Corporate AAA | 7/9/26 | 5.16% | 5.06% | 2.0% | 4.83% | 6.8% |
| US Corporate BBB | 7/9/26 | 5.45% | 5.40% | 0.9% | 5.28% | 3.2% |
| US Corporate CCC | 7/9/26 | 13.93% | 13.73% | 1.5% | 12.50% | 11.4% |
| Effective Fed Funds | 7/9/26 | 3.62% | 3.62% | 0.0% | 4.33% | -16.4% |
US Economy Indicators
| Indicator | As of | Latest | 1 Mo Ago | 1 Mo % | 1 Yr Ago | 1 Yr % |
|---|---|---|---|---|---|---|
| Consumer Sentiment | 6/30/26 | 49.50 | 49.80 | -0.6% | 60.70 | -18.5% |
| Unemployment Rate | 6/30/26 | 4.20% | 4.30% | -2.3% | 4.10% | 2.4% |
| Inflation Rate | 5/31/26 | 4.20% | 3.80% | 10.5% | 2.40% | 75.0% |
| Manufacturing PMI | 6/30/26 | 53.30 | 52.70 | 1.1% | 49.00 | 8.8% |
| Non Manufacturing PMI | 6/30/26 | 54.00 | 53.60 | 0.7% | 50.80 | 6.3% |
| Retail Sales | 5/31/26 | 662,752 | 655,933 | 1.0% | 616,231 | 7.5% |
| Building Permits | 5/31/26 | 1,413 | 1,423 | -0.7% | 1,416 | -0.2% |
Suggested Readings
- 1SK Hynix Raises $26.5B in the Biggest Foreign IPO in US History, Is Urged to Build New Fabs
- 2China is Catching Up to Elon Musk's Reusable Rockets
- 3Minutes of the Federal Open Market Committee: June 16-17, 2026
- 4IEA: Oil Market Report, July 2026
- 5PepsiCo Warns of Higher Commodity Costs Amid Faltering North American Food Sales
Leadership Insight
“Even after recent fare increases, airfares remain 10 to 15 points below overall inflation since COVID. With continued fuel volatility and much of the industry is still earning returns below its cost of capital, we believe current revenue momentum should remain sustainable even if fuel prices moderate. That is an important step towards improving the industry's financial health and earning sustainable returns over time.”
Stocks to Watch
For our full list of Stocks To Watch, contact Patrick Mullin at pmullin@timberpointcapital.com
U.S. equity indexes were mixed as investors considered renewed U.S.-Iran tensions and higher oil prices along with the start of 2Q26 earnings season. The Nasdaq led with a 1.7% gain and the S&P 500 rose 1.2%, while the DJIA declined 0.5% and the Russell 2000 fell 0.6%. Growth outperformed value, with information technology, energy, and communication services leading within the S&P 500, while materials and health care lagged. PEP reported earnings that suggested continued challenges with NAM results amid higher input costs that will result in continued SKU rationalization and ongoing cost efficiency measures. The economic calendar was light, but the FOMC minutes leaned hawkish as it showed policymakers were divided between holding rates steady and raising rates later this year, with some officials seeing enough evidence to hike at the June meeting. ISM services eased to 54.0 in June from 54.5 in May but remained expansionary, while the prices index declined to 67.7, still pointing to persistent cost pressures. S&P Global services PMI rose to 51.2, existing home sales fell to a 4.09M annual rate, initial jobless claims slipped to 215K, and continuing claims rose to 1.81M.
Rising oil prices and the more hawkish Fed backdrop pushed yields higher with the 10-year Treasury yield rising to 4.56% from 4.49% the prior week and 30-year yields rose 7 bp's to just shy of 5%. Market-implied odds of a July Fed hike rose to about 31% from 17%, while September hike odds increased to about 84% from 61%. Auctions for the 3-year, 10-year, and 30-year Treasuries were well received, with all three stopping through, a sign that demand for duration remains healthy even as supply concerns linger. WTI crude rose 4.2% and moved back above $70 per barrel as renewed U.S.-Iran hostilities and shipping disruptions in the SoH revived supply concerns, though late-week negotiations helped oil trim gains. Natural gas fell 7.9%, gold declined 1.9%, and silver dropped 4.6%. The USD index was unchanged while the yen continued weak.
| Asset Class | 1 Wk | 1 Mo | 3 Mo | YTD | 1 Yr | 3 Yr | 5 Yr |
|---|---|---|---|---|---|---|---|
| S&P 500 | 1.26% | 4.34% | 11.44% | 11.36% | 22.07% | 21.39% | 13.25% |
| Dow Jones Industrials Average | -0.50% | 5.54% | 10.29% | 10.46% | 19.85% | 17.86% | 10.67% |
| NASDAQ | 1.74% | 4.46% | 14.92% | 13.44% | 28.17% | 25.16% | 13.15% |
| S&P MidCap 400 | -0.60% | 2.98% | 7.65% | 15.16% | 19.80% | 14.49% | 8.57% |
| Russell 2000 | -0.61% | 5.14% | 13.52% | 20.71% | 33.20% | 17.86% | 6.94% |
| Russell Micro Cap | -1.14% | 8.22% | 15.91% | 24.61% | 47.40% | 22.81% | 7.01% |
| Sector | 1Wk | YTD |
|---|---|---|
| 0.10% | -1.43% | |
| 0.16% | 2.59% | |
| -2.15% | 13.13% | |
| -0.51% | 11.86% |
| Sector | 1Wk | YTD |
|---|---|---|
| 1.86% | -4.61% | |
| 3.49% | 24.87% | |
| -1.08% | 17.89% | |
| 2.87% | 29.35% |
| Sector | 1Wk | YTD |
|---|---|---|
| -1.02% | 9.66% | |
| -1.77% | 4.78% | |
| -0.76% | 7.79% |
| Style | 1 Wk | 1 Mo | 3 Mo | YTD | 1 Yr | 3 Yr | 5 Yr |
|---|---|---|---|---|---|---|---|
| Large Growth | 2.09% | 4.59% | 13.82% | 7.71% | 19.06% | 23.91% | 12.98% |
| Large Blend | 1.31% | 4.39% | 11.72% | 11.11% | 21.82% | 21.59% | 12.81% |
| Large Value | 0.13% | 4.17% | 9.46% | 16.02% | 24.80% | 18.46% | 12.27% |
| Mid Growth | 0.36% | 5.43% | 12.87% | 8.69% | 6.64% | 14.44% | 5.59% |
| Mid Blend | 0.49% | 4.63% | 9.50% | 12.37% | 15.63% | 15.36% | 7.88% |
| Mid Value | 0.58% | 4.00% | 7.01% | 14.73% | 22.18% | 15.64% | 9.78% |
| Small Growth | -1.21% | 4.70% | 12.21% | 17.49% | 25.62% | 15.96% | 4.68% |
| Small Blend | -0.82% | 4.13% | 9.88% | 16.34% | 23.35% | 15.87% | 7.36% |
| Small Value | -0.54% | 3.67% | 8.14% | 15.45% | 21.63% | 15.75% | 9.22% |
Buckle up...2Q26 earnings season is here and will be led by the major financials. YTD, financials (XLF) are the 3rd worst performing SPDR sector, but they have had a nice run over the past month with gains of 7% and they also outpaced all other R1K sectors this past week with 28 companies on the new high list. Investors wouldn't be so quick to rush to financials if they believed that the economy was slowing (dramatically, Atlanta Fed now at 1.3% for 2Q26) or in jeopardy of entering a period of credit deterioration. We believe that banks will set a relatively optimistic foundation for the balance of earnings to follow in subsequent weeks.
NFLX (Thur) has confused investors with its now scuttled acquisition of WBD and subsequent rumors of interest in LION. With the stock probing multi-year lows, management needs to convince investors of its organic growth opportunities. GE (Thur) is near recent highs and demand is solid but investors were spooked in 1Q26 by management's guidance for sluggish global departures owing to a low double digit decline in Middle East departures. Has that outlook changed?
June CPI (Tues) is expected to decline to sub 4% after hitting 4.2% in May, driven by higher energy prices. Retail sales (Thur) have continued to benefit from increases in inflation, clocking in at 6.9% y/y in May, the steepest yearly increase since Jan '23. US industrial production (Fri) likely continues its positive ways, up 1.7% y/y in May, after flatlining for much of '23 and '24 as AI infrastructure, commercial aircraft demand and factory automation lead the way.
| Company | Date | EPS Est. |
|---|---|---|
| Bank of America Corp. (BAC) | Tue Jul 14 | $1.15 |
| Citigroup, Inc. (C) | Tue Jul 14 | $2.69 |
| Fastenal Co. (FAST) | Tue Jul 14 | $0.33 |
| The Goldman Sachs Group, Inc. (GS) | Tue Jul 14 | $14.18 |
| JPMorgan Chase & Co. (JPM) | Tue Jul 14 | $5.48 |
| Wells Fargo & Co. (WFC) | Tue Jul 14 | $1.83 |
| BlackRock, Inc. (BLK) | Wed Jul 15 | $13.97 |
| Johnson & Johnson (JNJ) | Wed Jul 15 | $3.03 |
| Morgan Stanley (MS) | Wed Jul 15 | $2.95 |
| United Airlines Holdings, Inc. (UAL) | Wed Jul 15 | $3.45 |
| GE Aerospace (GE) | Thu Jul 16 | $1.91 |
| Netflix, Inc. (NFLX) | Thu Jul 16 | $0.84 |
| UnitedHealth Group, Inc. (UNH) | Thu Jul 16 | $3.74 |
| Data Release | Date | Est. |
|---|---|---|
| Small Business Optimism Index | Tue Jul 14 | 96.0 |
| US Consumer Price Index YoY | Tue Jul 14 | 3.9% |
| Fed Chair Warsh Testimony | Tue Jul 14 | N/A |
| US Producer Price Index YoY | Wed Jul 15 | 6.30% |
| Empire State Manufacturing Index | Wed Jul 15 | 6.20 |
| US Retail Sales YoY | Thu Jul 16 | 6.7% |
| Philly Fed Manufacturing Activity | Thu Jul 16 | 11.0 |
| US Pending Home Sales YoY | Thu Jul 16 | 2.3% |
| US Housing Starts | Thu Jul 16 | 1.2M |
| US Industrial Production YoY | Fri Jul 17 | 1.5% |
| US Index of Consumer Sentiment | Fri Jul 17 | 50.4 |
European equities pulled back from record highs as geopolitical tensions and higher crude prices raised concerns about inflation and additional central bank tightening. The STOXX Europe 600 fell 1.8%, Germany's DAX declined 2.8%, France's CAC 40 dropped 2.0% and the FTSE 100 lost 1.7%. Germany's annual inflation rate moderated to 2.3% in June from 2.6%, while higher German exports pointed to pockets of resilience beneath the risk-off tone. In the U.K., political developments remained in focus as Andy Burnham secured broad parliamentary backing to succeed Keir Starmer as Labour leader. Housing data stayed soft, with buyer inquiries and agreed sales still negative despite modest improvement.
Japan declined as higher oil as the Nikkei 225 fell 1.7% and TOPIX declined 0.7%. The 10-year JGB yield ended near 2.78%, little changed for the week after briefly reaching its highest level since 1996. Producer prices rose 7.1% y/y in June, above expectations, while nominal wages increased 3.2% y/y and real wages rose 1.4%, down from the prior month. Household spending fell 0.4% y/y, a smaller decline than expected, suggesting consumer demand remained more resilient than feared. The yen strengthened back into the JPY 161 range versus the USD after earlier weakness.
China equities followed suit as the CSI 300 fell 1.3% and the Shanghai Composite declined 1.2%. June CPI rose 1.0% y/y and core CPI edged down to 1.0%, while producer prices increased 4.1% y/y, the fastest since July 2022. The PBOC maintained an accommodative policy tone, pledging ample liquidity and targeted support for domestic demand though stopping short of announcing broad stimulus. Hong Kong's Hang Seng rose by 3.5%.
| Region | 1 Wk | 1 Mo | 3 Mo | YTD | 1 Yr | 3 Yr | 5 Yr |
|---|---|---|---|---|---|---|---|
| MSCI ACWI | 0.24% | 3.78% | 9.42% | 12.15% | 23.71% | 20.90% | 11.49% |
| MSCI ACWI ex USA | -1.31% | 2.61% | 5.57% | 13.39% | 26.63% | 19.33% | 8.95% |
| MSCI Emerging Markets | -1.74% | 1.74% | 9.97% | 21.70% | 39.82% | 22.52% | 7.69% |
| MSCI Europe Stock | -1.90% | 2.85% | 3.05% | 7.55% | 16.41% | 17.01% | 9.21% |
| MSCI Asia Pacific Stock | -1.41% | 2.46% | 9.77% | 20.44% | 36.59% | 21.38% | 8.51% |
| MSCI Latin America Stock | 1.91% | 6.10% | -8.10% | 13.61% | 38.23% | 13.35% | 10.49% |
| Rate | Latest | 1 Mo Ago | 1 Mo % | 1 Yr Ago | 1 Yr % |
|---|---|---|---|---|---|
| 1 Month Treasury | 3.71% | 3.69% | 0.5% | 4.36% | -14.9% |
| 2 Year Treasury | 4.21% | 4.13% | 1.9% | 3.86% | 9.1% |
| 10 Year Treasury | 4.56% | 4.55% | 0.2% | 4.35% | 4.8% |
| 30 Year Mortgage | 6.49% | 6.48% | 0.2% | 6.67% | -2.7% |
| US Corporate AAA | 5.16% | 5.06% | 2.0% | 4.83% | 6.8% |
| US Corporate BBB | 5.45% | 5.40% | 0.9% | 5.28% | 3.2% |
| US Corporate CCC | 13.93% | 13.73% | 1.5% | 12.50% | 11.4% |
| Effective Fed Funds | 3.62% | 3.62% | 0.0% | 4.33% | -16.4% |
| Indicator | Latest | 1 Mo Ago | 1 Mo % | 1 Yr Ago | 1 Yr % |
|---|---|---|---|---|---|
| Consumer Sentiment | 49.50 | 49.80 | -0.6% | 60.70 | -18.5% |
| Unemployment Rate | 4.20% | 4.30% | -2.3% | 4.10% | 2.4% |
| Inflation Rate | 4.20% | 3.80% | 10.5% | 2.40% | 75.0% |
| Manufacturing PMI | 53.30 | 52.70 | 1.1% | 49.00 | 8.8% |
| Non Manufacturing PMI | 54.00 | 53.60 | 0.7% | 50.80 | 6.3% |
| Retail Sales | 662,752 | 655,933 | 1.0% | 616,231 | 7.5% |
| Building Permits | 1,413 | 1,423 | -0.7% | 1,416 | -0.2% |
SEIC has been in a solid uptrend for the better part of 2 years and has recently broken above old highs going back to mid '25. Many financial stocks have been putting in multiple new highs over the course of '26 - we think SEIC could just be getting started.
“Even after recent fare increases, airfares remain 10 to 15 points below overall inflation since COVID. With continued fuel volatility and much of the industry is still earning returns below its cost of capital, we believe current revenue momentum should remain sustainable even if fuel prices moderate. That is an important step towards improving the industry's financial health and earning sustainable returns over time.”
For our full list of Stocks To Watch, contact Patrick Mullin at pmullin@timberpointcapital.com
©2020 YCharts, Inc. All Rights Reserved. YCharts, Inc. ("YCharts") is not registered with the U.S. Securities and Exchange Commission as an investment adviser, broker-dealer or in any other capacity, and does not purport to provide investment advice or make investment recommendations. This report has been generated through application of the analytical tools and data provided through ycharts.com and is intended solely to assist you or your investment or other adviser(s) in conducting investment research.
All data, statistics and charts are courtesy of YCharts unless otherwise noted. Investment Advice is offered through Fortis Capital Advisors, LLC, 7301 Mission Road, Suite 326, Prairie Village, KS 66208.
While reasonable efforts were used to obtain information from sources believed to be reliable, Fortis Capital Advisors, LLC makes no representation that the information or opinions contained in this material are accurate, reliable, or complete. All information and opinions are subject to change without notice. You should not construe this report as an offer to buy or sell, as a solicitation of an offer to buy or sell, or as a recommendation to buy, sell, hold or trade, any security or other financial instrument.
Past performance is not indicative of future results. Investing involves risk, including the possible loss of principal. The information contained herein is provided for informational purposes only and should not be construed as investment, tax, or legal advice. Recipients should consult their own advisers before making any investment decisions.
Source: Timber Point Capital Management. Powered by Fortis Capital Advisors. Investment Advice is offered through Fortis Capital Advisors, LLC, 7301 Mission Road, Suite 326, Prairie Village, KS 66208. All rights reserved.