
The Week That Was
U.S. equity indexes finished the holiday-shortened week mixed as quarter-end dip buying and broadening participation offset renewed pressure in semiconductors. The Nasdaq gained 1.5%, the DJIA rose 1.4%, and the S&P 500 advanced 1.4%, while the Russell 2000 declined 0.9%. The S&P 500 completed its best quarter since 2020 with a 15.2% total return, while delivering a 10.2% total return during the first half of 2026. Despite Technology (XLK) continuing to sell off, down 2.2%, other sectors picked up the slack as Healthcare (XLV) rose 5.2%, Financials (XLF) gained 4% and Consumer Cyclicals were higher by 3.3%. Large Growth shares rebounded by 3.2% for the week but ended lower by almost 5% for the month of June as Large Cap Value gained 3.2%. Small cap was positive across the style spectrum, though the Blend and Value segments led the way.
The week was chock full of labor market data with the focus on Friday's nonfarm payrolls which increased only 57K in June, below expectations near 110K, while April and May gains were revised down by a combined 74K. The unemployment rate declined to 4.2%, partly because labor-force participation fell to a five-year low of 61.5%. ADP private payrolls increased 98K, below estimates, while job openings rose to 7.6M, the highest since May 2024. All in, labor market data was softer than expected resulting in a reduced probability of a July Fed rate hike. ISM manufacturing declined to 53.3 but remained expansionary for a sixth month, while prices paid fell to 73.0 from 82.1, a welcome surprise. The Atlanta Fed's Q2 GDPNow estimate fell to 1.2% from 2.5%, primarily because of weaker net exports.
Treasury yields rose slightly with the 10-year yield rising to 4.48%, and the 30-year yield approaching 5%. WTI crude declined 1%, and is now near pre-war levels as tanker traffic through the Strait of Hormuz continues to recover. Gold gained 0.7% and silver rose 2.4%. The USD weakened Thursday on somewhat softer labor market data.
U.S. Equity Market Summary — As of 7/6/26
| Asset Class | 1 Wk | 1 Mo | 3 Mo | YTD | 1 Yr | 3 Yr | 5 Yr |
|---|---|---|---|---|---|---|---|
| S&P 500 | 2.52% | 2.17% | 14.33% | 10.79% | 21.49% | 21.17% | 13.28% |
| Dow Jones Industrials | 2.27% | 4.41% | 14.16% | 11.34% | 20.34% | 18.21% | 11.04% |
| NASDAQ | 3.26% | 1.64% | 18.93% | 12.74% | 27.57% | 24.92% | 13.07% |
| S&P MidCap 400 | 0.03% | 3.50% | 11.86% | 16.28% | 21.28% | 15.70% | 9.00% |
| Russell 2000 | -0.02% | 6.33% | 18.79% | 21.98% | 35.48% | 19.39% | 7.22% |
| Russell Micro Cap | 1.31% | 9.54% | 22.02% | 26.44% | 50.53% | 24.72% | 7.38% |
U.S. Sector Summary — As of 7/6/26
| Cyclical Sectors | 1 Wk | 1 Mo | 3 Mo | YTD | 1 Yr | 3 Yr | 5 Yr |
|---|---|---|---|---|---|---|---|
| Consumer Cyclical | 3.18% | 2.95% | 8.45% | -0.78% | 7.52% | 12.65% | 6.28% |
| Financials | 4.80% | 7.72% | 12.94% | 3.38% | 7.17% | 20.61% | 10.98% |
| Materials | 0.74% | 3.05% | 3.89% | 15.55% | 15.84% | 10.98% | 7.04% |
| Real Estate | -2.10% | -0.06% | 6.98% | 11.45% | 9.58% | 8.90% | 3.01% |
| Sensitive Sectors | 1 Wk | 1 Mo | 3 Mo | YTD | 1 Yr | 3 Yr | 5 Yr |
|---|---|---|---|---|---|---|---|
| Comm. Services | 3.80% | -1.05% | -1.13% | -5.83% | 3.29% | 20.42% | 7.20% |
| Energy | -1.32% | -7.22% | -10.34% | 20.45% | 25.87% | 13.91% | 19.20% |
| Industrials | 2.41% | 6.79% | 13.00% | 20.25% | 25.77% | 22.27% | 14.36% |
| Technology | 1.36% | 1.93% | 34.37% | 27.81% | 43.62% | 29.61% | 20.43% |
| Defensive Sectors | 1 Wk | 1 Mo | 3 Mo | YTD | 1 Yr | 3 Yr | 5 Yr |
|---|---|---|---|---|---|---|---|
| Consumer Defensive | -0.72% | 1.50% | 2.45% | 9.63% | 5.19% | 7.02% | 6.62% |
| Health Care | 1.01% | 6.31% | 11.20% | 5.51% | 21.61% | 9.27% | 6.50% |
| Utilities | -1.95% | 2.79% | -1.26% | 7.53% | 13.77% | 14.59% | 10.36% |
US Equity Style Summary — As of 7/6/26
| Equity Style | 1 Wk | 1 Mo | 3 Mo | YTD | 1 Yr | 3 Yr | 5 Yr |
|---|---|---|---|---|---|---|---|
| Large Growth | 4.38% | 1.01% | 17.21% | 6.82% | 18.16% | 23.42% | 12.87% |
| Large Blend | 2.60% | 2.14% | 14.54% | 10.51% | 21.14% | 21.38% | 12.81% |
| Large Value | 0.23% | 3.92% | 11.33% | 15.97% | 24.55% | 18.62% | 12.45% |
| Mid Growth | 1.93% | 4.05% | 16.02% | 9.54% | 6.94% | 15.42% | 5.78% |
| Mid Blend | 1.10% | 3.37% | 11.41% | 12.34% | 15.67% | 15.90% | 7.98% |
| Mid Value | 0.47% | 2.84% | 8.02% | 13.99% | 22.00% | 15.83% | 9.84% |
| Small Growth | 0.86% | 5.52% | 17.15% | 19.75% | 28.73% | 17.80% | 5.06% |
| Small Blend | 0.49% | 4.91% | 13.89% | 17.73% | 25.57% | 17.28% | 7.72% |
| Small Value | 0.20% | 4.43% | 11.49% | 16.21% | 23.19% | 16.84% | 9.58% |
International Equity Market Summary — As of 7/6/26
European equities rallied on lower oil prices and a hopeful view of resolution of the Middle East conflict. The STOXX Europe 600 rose 2.0%, Germany's DAX gained 3.7%, France's CAC 40 advanced 1.1% and the FTSE 100 climbed 1.4%. Eurozone inflation slowed to 2.8% in June from 3.2%, below expectations and reducing urgency for another ECB rate increase. German retail sales rose 1.1% m/m in May, while eurozone unemployment remained at 6.2%. Final data showed U.K. GDP grew 0.6% in the first quarter, and house prices increased 2.2% y/y in June.
Japan's Nikkei 225 fell 0.9%, while the TOPIX gained 1.3% on weaker technology shares but a broadening of buyers interested in financials and industrials. The BoJ Tankan index for large manufacturers rose to 22 from 17, its strongest reading since 2018, supported by AI-related semiconductor demand and capital spending. Industrial production increased 0.5% m/m, below expectations. The 10-year JGB yield rose to 2.78% from 2.60% amid inflation, fiscal, and supply concerns. The yen briefly weakened to JPY 162.5 versus USD before rebounding on renewed intervention speculation.
China equities were mixed as the CSI 300 fell 1.2%, while the Shanghai Composite was flat, both held back by weaker technology shares. The Official manufacturing PMI rose to 50.3 from 50.0, nonmanufacturing PMI increased to 50.2, and the private RatingDog manufacturing PMI eased slightly to 51.7. The PBOC launched overnight reverse-repo operations, providing CNY 300B Monday and CNY 600B Tuesday at a reported 1.25% rate, improving short-term liquidity without signaling broad easing. Hong Kong's Hang Seng finished up 1.7%.
| Region | 1 Wk | 1 Mo | 3 Mo | YTD | 1 Yr | 3 Yr | 5 Yr |
|---|---|---|---|---|---|---|---|
| MSCI ACWI | 1.47% | 2.18% | 13.71% | 12.31% | 23.98% | 21.03% | 11.54% |
| MSCI ACWI ex USA | 1.65% | 1.90% | 12.12% | 14.69% | 28.36% | 19.94% | 9.06% |
| MSCI Emerging Markets | 0.97% | 0.56% | 19.50% | 23.86% | 42.31% | 23.13% | 7.63% |
| MSCI Europe | 2.15% | 3.47% | 9.37% | 9.01% | 19.55% | 18.02% | 9.66% |
| MSCI Asia Pacific | 1.35% | 0.94% | 17.80% | 22.24% | 38.03% | 21.79% | 8.40% |
| MSCI Latin America | 0.74% | 3.36% | -4.08% | 11.60% | 30.14% | 13.12% | 9.99% |
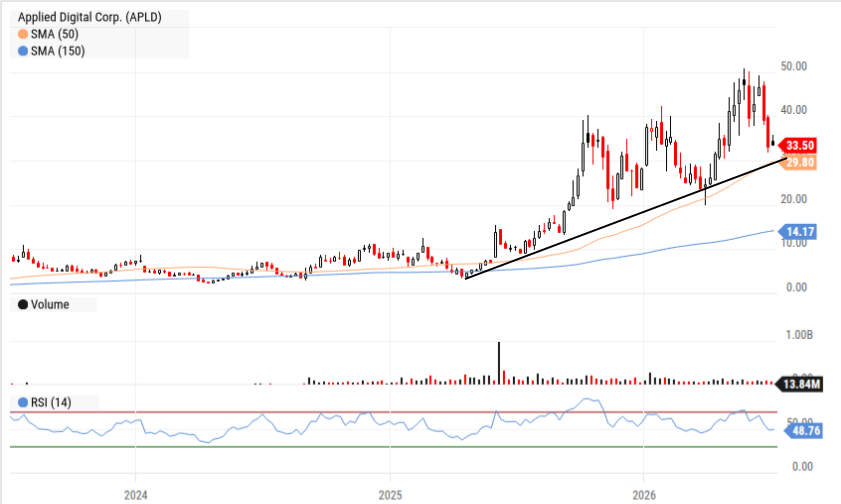
Chart of the Week — 7/6/26
It has been a swift retreat for APLD from the $50 level it reached just a month or so ago as it has been caught up in the technology selloff. We think that it has a good chance of “digging in” at current levels as it reaches trendline support and its 200 dma (not shown). Buy the weakness down to $30.
The Week Ahead
The calm before the storm this week as 2Q26 earnings will begin in earnest next week and investors can't be faulted for perhaps taking a bit of a respite after the strong performance for equities in 2Q26. That said, PEP will be the first SPX company to report EPS with investors having bid the staples sector higher recently as they seek refuge from technology share declines. PEP (Thur) hopes to reverse recent volume declines in its NAM snacks and beverage segments with “value” pricing while at the same time attempting to recoup margins via a significant restructuring. DAL (Fri) is managing a massive fuel cost headwind despite record revenues which is resulting in an aggressive capacity reduction and targeted fare increases to maintain margins.
On the economic front, the ISM Services PMI (Mon) should continue to remain in expansionary territory (>50.0) with recent strength from new orders partially offset by weaker employment trends and pricing pressure. The FOMC will release minutes (Wed) from new Chair Walsh's first meeting which showed a hawkish shift with the median projection suggesting at least one 25 bps rate hike before the end of 2026.
10-year and 30-year bond auctions (Thur) will highlight the demand for US government debt in a scenario of higher inflation and higher deficits, despite Warsh's best efforts. Finally, Warsh has stated that he wants to reduce the Fed's balance sheet (Thur) which currently sits at $6.725T, down from a peak of almost $9T in early '22, but up slightly from its early '26 low of $6.6T.
| Company | Date | EPS Est. |
|---|---|---|
| Kura Sushi USA, Inc. (KRUS) | Tue Jul 7 | $0.16 |
| Penguin Solutions, Inc. (PENG) | Tue Jul 7 | $0.70 |
| Helen of Troy Ltd. (HELE) | Wed Jul 8 | $0.49 |
| AZZ, Inc. (AZZ) | Wed Jul 8 | $1.84 |
| PriceSmart, Inc. (PSMT) | Wed Jul 8 | $1.19 |
| PepsiCo, Inc. (PEP) | Thu Jul 9 | $2.43 |
| The Simply Good Foods Co. (SMPL) | Thu Jul 9 | $0.46 |
| Simulations Plus, Inc. (SLP) | Thu Jul 9 | $0.16 |
| WD-40 Co. (WDFC) | Thu Jul 9 | $1.66 |
| Delta Air Lines, Inc. (DAL) | Fri Jul 10 | $1.96 |
| Data Release | Date | Est. |
|---|---|---|
| NY Fed Consumer Inflation Expectations | Tue Jul 7 | 3.2% |
| US ISM Services PMI | Wed Jul 8 | 54.0 |
| 10-Year Note Auction | Wed Jul 8 | N/A |
| FOMC Minutes | Wed Jul 8 | N/A |
| Consumer Credit Change | Wed Jul 8 | $19.0B |
| US Trade Balance | Thu Jul 9 | -$85.2B |
| US Existing Home Sales | Thu Jul 9 | 4.07M |
| 30-Year Bond Auction | Thu Jul 9 | N/A |
| US Oil Rig Count | Thu Jul 9 | N/A |
Key Interest Rates — As of 7/6/26
| Rate | As of | Latest | 1 Mo Ago | 1 Mo % | 1 Yr Ago | 1 Yr % |
|---|---|---|---|---|---|---|
| 1 Month Treasury | 7/6/26 | 3.69% | 3.71% | -0.5% | 4.35% | -15.2% |
| 2 Year Treasury | 7/6/26 | 4.13% | 4.17% | -1.0% | 3.88% | 6.4% |
| 10 Year Treasury | 7/6/26 | 4.48% | 4.55% | -1.5% | 4.35% | 3.0% |
| 30 Year Mortgage | 7/2/26 | 6.43% | 6.53% | -1.5% | 6.77% | -5.0% |
| US Corporate AAA | 7/3/26 | 5.07% | 5.02% | 1.0% | 4.81% | 5.4% |
| US Corporate BBB | 7/3/26 | 5.38% | 5.36% | 0.4% | 5.26% | 2.3% |
| US Corporate CCC | 7/3/26 | 13.85% | 13.64% | 1.5% | 12.56% | 10.3% |
| Effective Fed Funds | 7/3/26 | 3.63% | 3.62% | 0.3% | 4.33% | -16.2% |
US Economy Indicators
| Indicator | As of | Latest | 1 Mo Ago | 1 Mo % | 1 Yr Ago | 1 Yr % |
|---|---|---|---|---|---|---|
| Consumer Sentiment | 6/30/26 | 49.50 | 49.80 | -0.6% | 60.70 | -18.5% |
| Unemployment Rate | 6/30/26 | 4.20% | 4.30% | -2.3% | 4.10% | 2.4% |
| Inflation Rate | 5/31/26 | 4.20% | 3.80% | 10.5% | 2.40% | 75.0% |
| Manufacturing PMI | 6/30/26 | 53.30 | 52.70 | 1.1% | 49.00 | 8.8% |
| Non Manufacturing PMI | 6/30/26 | 54.00 | 53.60 | 0.7% | 50.80 | 6.3% |
| Retail Sales | 5/31/26 | 662,752 | 655,933 | 1.0% | 616,231 | 7.5% |
| Building Permits | 5/31/26 | 1,413 | 1,423 | -0.7% | 1,416 | -0.2% |
Suggested Readings
- 1Claude Enterprise Spend Controls Arrive as Agentic AI Bills Blow Past Budgets
- 2June Jobs Report Shows 57K Payroll Gain, Unemployment at 4.2%
- 3Nike Q4 Conference Call: "We Know We're Not Living Up to Our Full Potential"
- 4When Are the Big Rockets NASA Desperately Needs Going to Be Ready?
- 5BYD Battery Breakthrough Crashes Indonesia's Nickel Cartel Dream
Leadership Insight
“Overall, the results aren't there yet. We know we're not living up to our full potential, particularly in NIKE Sportswear and Jordan Streetwear, where sell-through remains challenged, impacting both current discounting and future order books. We're operating in a more complex macro environment, where we're seeing added pressure on traffic and discretionary spending across our geographies.”
Stocks to Watch
For our full list of Stocks To Watch, contact Patrick Mullin at pmullin@timberpointcapital.com
U.S. equity indexes finished the holiday-shortened week mixed as quarter-end dip buying and broadening participation offset renewed pressure in semiconductors. The Nasdaq gained 1.5%, the DJIA rose 1.4%, and the S&P 500 advanced 1.4%, while the Russell 2000 declined 0.9%. The S&P 500 completed its best quarter since 2020 with a 15.2% total return, while delivering a 10.2% total return during the first half of 2026. Despite Technology (XLK) continuing to sell off, down 2.2%, other sectors picked up the slack as Healthcare (XLV) rose 5.2%, Financials (XLF) gained 4% and Consumer Cyclicals were higher by 3.3%. Large Growth shares rebounded by 3.2% for the week but ended lower by almost 5% for the month of June as Large Cap Value gained 3.2%. Small cap was positive across the style spectrum, though the Blend and Value segments led the way.
The week was chock full of labor market data with the focus on Friday's nonfarm payrolls which increased only 57K in June, below expectations near 110K, while April and May gains were revised down by a combined 74K. The unemployment rate declined to 4.2%, partly because labor-force participation fell to a five-year low of 61.5%. ADP private payrolls increased 98K, below estimates, while job openings rose to 7.6M, the highest since May 2024. All in, labor market data was softer than expected resulting in a reduced probability of a July Fed rate hike. ISM manufacturing declined to 53.3 but remained expansionary for a sixth month, while prices paid fell to 73.0 from 82.1, a welcome surprise. The Atlanta Fed's Q2 GDPNow estimate fell to 1.2% from 2.5%, primarily because of weaker net exports. Treasury yields rose slightly with the 10-year yield rising to 4.48%, and the 30-year yield approaching 5%. WTI crude declined 1%, and is now near pre-war levels as tanker traffic through the Strait of Hormuz continues to recover. Gold gained 0.7% and silver rose 2.4%. The USD weakened Thursday on somewhat softer labor market data.
| Asset Class | 1 Wk | 1 Mo | 3 Mo | YTD | 1 Yr | 3 Yr | 5 Yr |
|---|---|---|---|---|---|---|---|
| S&P 500 | 2.52% | 2.17% | 14.33% | 10.79% | 21.49% | 21.17% | 13.28% |
| Dow Jones Industrials | 2.27% | 4.41% | 14.16% | 11.34% | 20.34% | 18.21% | 11.04% |
| NASDAQ | 3.26% | 1.64% | 18.93% | 12.74% | 27.57% | 24.92% | 13.07% |
| S&P MidCap 400 | 0.03% | 3.50% | 11.86% | 16.28% | 21.28% | 15.70% | 9.00% |
| Russell 2000 | -0.02% | 6.33% | 18.79% | 21.98% | 35.48% | 19.39% | 7.22% |
| Russell Micro Cap | 1.31% | 9.54% | 22.02% | 26.44% | 50.53% | 24.72% | 7.38% |
| Sector | 1Wk | YTD |
|---|---|---|
| 3.18% | -0.78% | |
| 4.80% | 3.38% | |
| 0.74% | 15.55% | |
| -2.10% | 11.45% |
| Sector | 1Wk | YTD |
|---|---|---|
| 3.80% | -5.83% | |
| -1.32% | 20.45% | |
| 2.41% | 20.25% | |
| 1.36% | 27.81% |
| Sector | 1Wk | YTD |
|---|---|---|
| -0.72% | 9.63% | |
| 1.01% | 5.51% | |
| -1.95% | 7.53% |
| Style | 1 Wk | 1 Mo | 3 Mo | YTD | 1 Yr | 3 Yr | 5 Yr |
|---|---|---|---|---|---|---|---|
| Large Growth | 4.38% | 1.01% | 17.21% | 6.82% | 18.16% | 23.42% | 12.87% |
| Large Blend | 2.60% | 2.14% | 14.54% | 10.51% | 21.14% | 21.38% | 12.81% |
| Large Value | 0.23% | 3.92% | 11.33% | 15.97% | 24.55% | 18.62% | 12.45% |
| Mid Growth | 1.93% | 4.05% | 16.02% | 9.54% | 6.94% | 15.42% | 5.78% |
| Mid Blend | 1.10% | 3.37% | 11.41% | 12.34% | 15.67% | 15.90% | 7.98% |
| Mid Value | 0.47% | 2.84% | 8.02% | 13.99% | 22.00% | 15.83% | 9.84% |
| Small Growth | 0.86% | 5.52% | 17.15% | 19.75% | 28.73% | 17.80% | 5.06% |
| Small Blend | 0.49% | 4.91% | 13.89% | 17.73% | 25.57% | 17.28% | 7.72% |
| Small Value | 0.20% | 4.43% | 11.49% | 16.21% | 23.19% | 16.84% | 9.58% |
The calm before the storm this week as 2Q26 earnings will begin in earnest next week and investors can't be faulted for perhaps taking a bit of a respite after the strong performance for equities in 2Q26. That said, PEP will be the first SPX company to report EPS with investors having bid the staples sector higher recently as they seek refuge from technology share declines. PEP (Thur) hopes to reverse recent volume declines in its NAM snacks and beverage segments with “value” pricing while at the same time attempting to recoup margins via a significant restructuring. DAL (Fri) is managing a massive fuel cost headwind despite record revenues which is resulting in an aggressive capacity reduction and targeted fare increases to maintain margins.
On the economic front, the ISM Services PMI (Mon) should continue to remain in expansionary territory (>50.0) with recent strength from new orders partially offset by weaker employment trends and pricing pressure. The FOMC will release minutes (Wed) from new Chair Walsh's first meeting which showed a hawkish shift with the median projection suggesting at least one 25 bps rate hike before the end of 2026.
10-year and 30-year bond auctions (Thur) will highlight the demand for US government debt in a scenario of higher inflation and higher deficits, despite Warsh's best efforts. Finally, Warsh has stated that he wants to reduce the Fed's balance sheet (Thur) which currently sits at $6.725T, down from a peak of almost $9T in early '22, but up slightly from its early '26 low of $6.6T.
| Company | Date | EPS Est. |
|---|---|---|
| Kura Sushi USA, Inc. (KRUS) | Tue Jul 7 | $0.16 |
| Penguin Solutions, Inc. (PENG) | Tue Jul 7 | $0.70 |
| Helen of Troy Ltd. (HELE) | Wed Jul 8 | $0.49 |
| AZZ, Inc. (AZZ) | Wed Jul 8 | $1.84 |
| PriceSmart, Inc. (PSMT) | Wed Jul 8 | $1.19 |
| PepsiCo, Inc. (PEP) | Thu Jul 9 | $2.43 |
| The Simply Good Foods Co. (SMPL) | Thu Jul 9 | $0.46 |
| Simulations Plus, Inc. (SLP) | Thu Jul 9 | $0.16 |
| WD-40 Co. (WDFC) | Thu Jul 9 | $1.66 |
| Delta Air Lines, Inc. (DAL) | Fri Jul 10 | $1.96 |
| Data Release | Date | Est. |
|---|---|---|
| NY Fed Consumer Inflation Expectations | Tue Jul 7 | 3.2% |
| US ISM Services PMI | Wed Jul 8 | 54.0 |
| 10-Year Note Auction | Wed Jul 8 | N/A |
| FOMC Minutes | Wed Jul 8 | N/A |
| Consumer Credit Change | Wed Jul 8 | $19.0B |
| US Trade Balance | Thu Jul 9 | -$85.2B |
| US Existing Home Sales | Thu Jul 9 | 4.07M |
| 30-Year Bond Auction | Thu Jul 9 | N/A |
| US Oil Rig Count | Thu Jul 9 | N/A |
European equities rallied on lower oil prices and a hopeful view of resolution of the Middle East conflict. The STOXX Europe 600 rose 2.0%, Germany's DAX gained 3.7%, France's CAC 40 advanced 1.1% and the FTSE 100 climbed 1.4%. Eurozone inflation slowed to 2.8% in June from 3.2%, below expectations and reducing urgency for another ECB rate increase. German retail sales rose 1.1% m/m in May, while eurozone unemployment remained at 6.2%. Final data showed U.K. GDP grew 0.6% in the first quarter, and house prices increased 2.2% y/y in June.
Japan's Nikkei 225 fell 0.9%, while the TOPIX gained 1.3% on weaker technology shares but a broadening of buyers interested in financials and industrials. The BoJ Tankan index for large manufacturers rose to 22 from 17, its strongest reading since 2018, supported by AI-related semiconductor demand and capital spending. Industrial production increased 0.5% m/m, below expectations. The 10-year JGB yield rose to 2.78% from 2.60% amid inflation, fiscal, and supply concerns. The yen briefly weakened to JPY 162.5 versus USD before rebounding on renewed intervention speculation.
China equities were mixed as the CSI 300 fell 1.2%, while the Shanghai Composite was flat, both held back by weaker technology shares. The Official manufacturing PMI rose to 50.3 from 50.0, nonmanufacturing PMI increased to 50.2, and the private RatingDog manufacturing PMI eased slightly to 51.7. The PBOC launched overnight reverse-repo operations, providing CNY 300B Monday and CNY 600B Tuesday at a reported 1.25% rate, improving short-term liquidity without signaling broad easing. Hong Kong's Hang Seng finished up 1.7%.
| Region | 1 Wk | 1 Mo | 3 Mo | YTD | 1 Yr | 3 Yr | 5 Yr |
|---|---|---|---|---|---|---|---|
| MSCI ACWI | 1.47% | 2.18% | 13.71% | 12.31% | 23.98% | 21.03% | 11.54% |
| MSCI ACWI ex USA | 1.65% | 1.90% | 12.12% | 14.69% | 28.36% | 19.94% | 9.06% |
| MSCI Emerging Markets | 0.97% | 0.56% | 19.50% | 23.86% | 42.31% | 23.13% | 7.63% |
| MSCI Europe | 2.15% | 3.47% | 9.37% | 9.01% | 19.55% | 18.02% | 9.66% |
| MSCI Asia Pacific | 1.35% | 0.94% | 17.80% | 22.24% | 38.03% | 21.79% | 8.40% |
| MSCI Latin America | 0.74% | 3.36% | -4.08% | 11.60% | 30.14% | 13.12% | 9.99% |
| Rate | Latest | 1 Mo Ago | 1 Mo % | 1 Yr Ago | 1 Yr % |
|---|---|---|---|---|---|
| 1 Month Treasury | 3.69% | 3.71% | -0.5% | 4.35% | -15.2% |
| 2 Year Treasury | 4.13% | 4.17% | -1.0% | 3.88% | 6.4% |
| 10 Year Treasury | 4.48% | 4.55% | -1.5% | 4.35% | 3.0% |
| 30 Year Mortgage | 6.43% | 6.53% | -1.5% | 6.77% | -5.0% |
| US Corporate AAA | 5.07% | 5.02% | 1.0% | 4.81% | 5.4% |
| US Corporate BBB | 5.38% | 5.36% | 0.4% | 5.26% | 2.3% |
| US Corporate CCC | 13.85% | 13.64% | 1.5% | 12.56% | 10.3% |
| Effective Fed Funds | 3.63% | 3.62% | 0.3% | 4.33% | -16.2% |
| Indicator | Latest | 1 Mo Ago | 1 Mo % | 1 Yr Ago | 1 Yr % |
|---|---|---|---|---|---|
| Consumer Sentiment | 49.50 | 49.80 | -0.6% | 60.70 | -18.5% |
| Unemployment Rate | 4.20% | 4.30% | -2.3% | 4.10% | 2.4% |
| Inflation Rate | 4.20% | 3.80% | 10.5% | 2.40% | 75.0% |
| Manufacturing PMI | 53.30 | 52.70 | 1.1% | 49.00 | 8.8% |
| Non Manufacturing PMI | 54.00 | 53.60 | 0.7% | 50.80 | 6.3% |
| Retail Sales | 662,752 | 655,933 | 1.0% | 616,231 | 7.5% |
| Building Permits | 1,413 | 1,423 | -0.7% | 1,416 | -0.2% |
It has been a swift retreat for APLD from the $50 level it reached just a month or so ago as it has been caught up in the technology selloff. We think that it has a good chance of “digging in” at current levels as it reaches trendline support and its 200 dma (not shown). Buy the weakness down to $30.
“Overall, the results aren't there yet. We know we're not living up to our full potential, particularly in NIKE Sportswear and Jordan Streetwear, where sell-through remains challenged, impacting both current discounting and future order books. We're operating in a more complex macro environment, where we're seeing added pressure on traffic and discretionary spending across our geographies.”
For our full list of Stocks To Watch, contact Patrick Mullin at pmullin@timberpointcapital.com
©2020 YCharts, Inc. All Rights Reserved. YCharts, Inc. ("YCharts") is not registered with the U.S. Securities and Exchange Commission as an investment adviser, broker-dealer or in any other capacity, and does not purport to provide investment advice or make investment recommendations. This report has been generated through application of the analytical tools and data provided through ycharts.com and is intended solely to assist you or your investment or other adviser(s) in conducting investment research.
All data, statistics and charts are courtesy of YCharts unless otherwise noted. Investment Advice is offered through Fortis Capital Advisors, LLC, 7301 Mission Road, Suite 326, Prairie Village, KS 66208.
While reasonable efforts were used to obtain information from sources believed to be reliable, Fortis Capital Advisors, LLC makes no representation that the information or opinions contained in this material are accurate, reliable, or complete. All information and opinions are subject to change without notice. You should not construe this report as an offer to buy or sell, as a solicitation of an offer to buy or sell, or as a recommendation to buy, sell, hold or trade, any security or other financial instrument.
Past performance is not indicative of future results. Investing involves risk, including the possible loss of principal. The information contained herein is provided for informational purposes only and should not be construed as investment, tax, or legal advice. Recipients should consult their own advisers before making any investment decisions.
Source: Timber Point Capital Management. Powered by Fortis Capital Advisors. Investment Advice is offered through Fortis Capital Advisors, LLC, 7301 Mission Road, Suite 326, Prairie Village, KS 66208. All rights reserved.