
The Week That Was
U.S. equities rose sharply as strong corporate earnings, renewed enthusiasm for AI-related shares, lower oil prices, and softer labor data drew investors back into risk assets. The Nasdaq led with a 5.2% gain, followed by the SPX at 3.6%, the R2K at 3.5%, and the DJIA at 3.0%. The SPX and DJIA closed at record highs while the Nasdaq posted its strongest week since April. Nine of eleven SPX sectors finished higher, led by Information Technology (XLK), up 7.0%, and Materials (XLB), up 5.6%. Energy (XLE) fell 3.6% on lower oil prices and Utilities (XLU) declined 1.4%. Technology rebounded as AI spending showed signs of translating into revenue growth across software, cloud infrastructure, and semiconductors. Materials benefited from price gains in gold, silver, and copper. All style segments were positive for the week with Small and Large Growth leading the way, up 6% and 5%, respectively.
Labor data were the week's most important macro catalyst. Nonfarm payrolls unexpectedly declined by 23K in July versus expectations for an increase of roughly 80K, while June payroll growth was revised to 20K from 57K and May to 63K from 129K. Job losses were focused in the government sector (50K) as private payrolls expanded by 30K despite a 19K loss from the retail trade segment. The unemployment rate slipped to 4.1%, partly because labor-force participation fell to 61.4%, the lowest in more than five years. ADP reported 44K private-sector jobs in July, below estimates of 70K, and JOLTS job openings eased slightly to 7.36M, a slight downtick versus the prior two months. The softer employment picture reduced the probability of a September Fed rate increase to roughly 42% by Friday from about 71% the prior week (CME Fedwatch).
Business activity remained comparatively strong. The ISM Manufacturing Index rose to 55.6 in July, its highest reading since May 2022, while the ISM Services Index held at 54.1. New orders remained firm, but the services employment component moved back into contraction and the prices index rose to 70.3, underscoring the tension between slowing hiring and still-elevated input costs. The Fed continues to deal with a slightly more complicated inflation-growth mix heading into this week's CPI and PPI reports.
Treasury yields declined on the softer employment data and hopes for progress on reopening the Strait of Hormuz which helped lower crude prices. The 2-year Treasury yield declined about 9 basis points to 4.20%, the 10-year fell about 9 basis points to 4.65%, and the 30-year eased roughly 7 basis points to 5.20%. Oil fell 8.7% while gold rallied 7.5%, silver gained 10.4% and copper rallied 2% after having been up as much as 5% earlier in the week. The USD weakened following the payroll report.
U.S. Equity Market Summary — As of 8/7/26
| Asset Class | 1 Wk | 1 Mo | 3 Mo | YTD | 1 Yr | 3 Yr | 5 Yr |
|---|---|---|---|---|---|---|---|
| S&P 500 | 3.59% | 3.44% | 6.04% | 14.09% | 23.83% | 21.35% | 13.44% |
| Dow Jones Industrials Average | 2.96% | 2.13% | 9.39% | 13.43% | 24.94% | 17.16% | 11.04% |
| NASDAQ | 5.19% | 3.39% | 3.58% | 15.22% | 26.41% | 24.87% | 13.29% |
| S&P MidCap 400 | 3.38% | 3.08% | 5.88% | 18.43% | 26.08% | 14.57% | 9.08% |
| Russell 2000 | 3.52% | 1.80% | 7.18% | 23.06% | 38.71% | 17.30% | 7.65% |
| Russell Micro Cap | 5.72% | 1.68% | 8.39% | 26.75% | 53.58% | 22.66% | 7.88% |
U.S. Sector Summary — As of 8/7/26
| Cyclical Sectors | 1 Wk | 1 Mo | 3 Mo | YTD | 1 Yr | 3 Yr | 5 Yr |
|---|---|---|---|---|---|---|---|
| Consumer Cyclical | 3.25% | 2.10% | 0.19% | 0.78% | 8.14% | 12.32% | 6.65% |
| Financials | 1.16% | 2.77% | 12.13% | 6.07% | 13.86% | 19.48% | 10.65% |
| Materials | 4.82% | 2.62% | 3.23% | 17.51% | 22.43% | 10.00% | 6.76% |
| Real Estate | -0.20% | 0.20% | 2.18% | 13.19% | 11.85% | 9.88% | 2.61% |
| Sensitive Sectors | 1 Wk | 1 Mo | 3 Mo | YTD | 1 Yr | 3 Yr | 5 Yr |
|---|---|---|---|---|---|---|---|
| Comm. Services | 2.78% | 0.21% | -4.97% | -4.95% | 5.02% | 19.08% | 7.17% |
| Energy | -3.44% | 5.23% | 3.50% | 30.36% | 40.48% | 13.29% | 22.72% |
| Industrials | 2.97% | 1.54% | 6.69% | 20.00% | 24.44% | 20.83% | 14.03% |
| Technology | 7.20% | 4.91% | 10.90% | 30.88% | 43.53% | 30.72% | 20.31% |
| Defensive Sectors | 1 Wk | 1 Mo | 3 Mo | YTD | 1 Yr | 3 Yr | 5 Yr |
|---|---|---|---|---|---|---|---|
| Consumer Defensive | 0.08% | 0.31% | 2.07% | 10.96% | 6.39% | 7.05% | 6.48% |
| Health Care | 1.93% | 0.75% | 14.98% | 7.94% | 30.66% | 9.16% | 6.20% |
| Utilities | -1.67% | -4.57% | -2.73% | 3.52% | 3.57% | 14.25% | 8.48% |
US Equity Style Summary — As of 8/7/26
| Equity Style | 1 Wk | 1 Mo | 3 Mo | YTD | 1 Yr | 3 Yr | 5 Yr |
|---|---|---|---|---|---|---|---|
| Large Growth | 4.94% | 4.08% | 4.00% | 10.19% | 18.31% | 24.09% | 13.07% |
| Large Blend | 3.67% | 3.42% | 6.20% | 13.83% | 23.34% | 21.54% | 13.00% |
| Large Value | 2.04% | 2.17% | 9.52% | 18.75% | 29.59% | 18.02% | 12.53% |
| Mid Growth | 3.60% | 1.80% | 5.35% | 10.10% | 7.12% | 14.79% | 5.49% |
| Mid Blend | 2.21% | 2.61% | 7.23% | 14.84% | 18.09% | 15.71% | 8.04% |
| Mid Value | 1.19% | 3.22% | 8.67% | 18.04% | 26.36% | 15.93% | 10.18% |
| Small Growth | 5.98% | 1.79% | 5.75% | 19.71% | 29.29% | 16.52% | 5.22% |
| Small Blend | 3.73% | 2.56% | 7.05% | 19.45% | 29.02% | 15.91% | 8.05% |
| Small Value | 2.14% | 3.12% | 8.00% | 19.21% | 28.74% | 15.39% | 10.03% |
International Equity Market Summary — As of 8/7/26
European equities advanced for a fourth consecutive week as strong corporate earnings and lower energy prices supported risk appetite. The STOXX Europe 600 gained 1.7%, Germany's DAX rose 2.7%, France's CAC 40 advanced 2.4% and the UK's FTSE 100 gained 0.3%. Technology and materials-related shares were among the stronger groups as investors responded to revenue beats and higher copper prices. Eurozone Services PMI moved to 51.7, its highest level in five months, but was uneven across geographies as the two largest economies, France and Germany, remained in contractionary territory (<50.0), despite small upticks in June.
Japanese equities finished higher, with the Nikkei 225 gaining 1.9% and the TOPIX rising 1.8%. Markets continued to assess the impact of the prior week's coordinated U.S.-Japan currency intervention, while expectations remained elevated that the BoJ could tighten policy again later this year. The yen weakened back through JPY 158 per USD after its intervention-driven rebound, and the 10-year JGB yield finished near 2.79%. Positive semiconductor earnings and lower oil prices helped offset early-week currency volatility.
Mainland Chinese equities outperformed as technology and semiconductor shares rallied. The Shanghai Composite gained 2.8% and the CSI 300 rose 2.3%. Investors remained enthusiastic about lower-cost domestic AI development and optical-networking demand, although private-sector PMI data pointed to slower activity as manufacturing eased to 50.9 in July and services declined to 50.4. Exports remained strong, rising 23.9% y/y in USD terms, while imports increased 27.5%. In Hong Kong, the Hang Seng fell 0.8%.
| Region | 1 Wk | 1 Mo | 3 Mo | YTD | 1 Yr | 3 Yr | 5 Yr |
|---|---|---|---|---|---|---|---|
| MSCI ACWI | 2.85% | 2.87% | 4.92% | 14.81% | 25.31% | 20.78% | 11.77% |
| MSCI ACWI ex USA | 1.49% | 1.90% | 2.53% | 15.77% | 28.06% | 19.07% | 9.32% |
| MSCI Emerging Markets | -0.43% | -1.56% | -3.15% | 19.53% | 33.93% | 20.32% | 7.68% |
| MSCI Europe Stock | 2.17% | 3.18% | 6.11% | 11.92% | 23.40% | 17.51% | 9.71% |
| MSCI Asia Pacific Stock | 0.44% | 0.02% | -0.39% | 20.34% | 32.09% | 20.13% | 8.68% |
| MSCI Latin America Stock | -1.51% | 2.66% | -3.96% | 14.15% | 37.31% | 13.22% | 10.74% |
Chart of the Week — 8/10/26
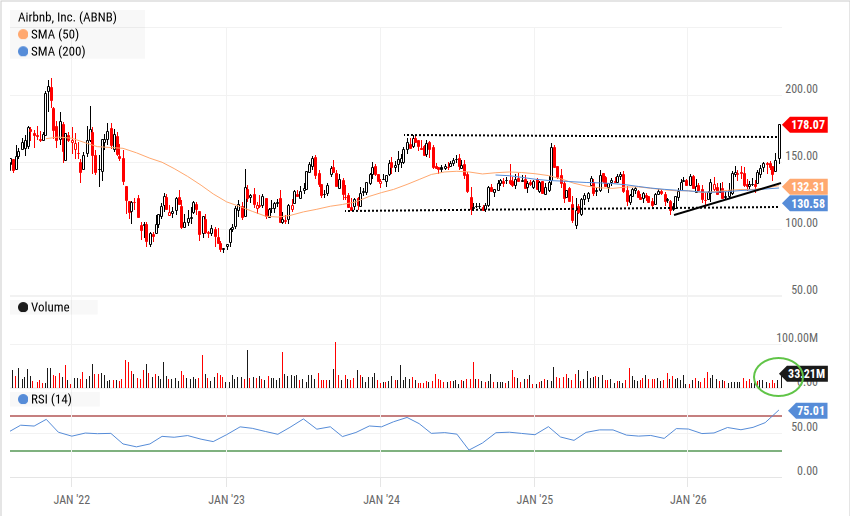
ABNB has been trading a range between $120 and $170 for the better part of the past 3 years. Recent action has seen it move above the high end of the range on larger than normal volume suggesting that the advance has staying power. We believe ABNB can attempt to move to the $200 level before it meets intermediate resistance. We would buy shares on the breakout and more if/when it retraces to $170 support.
The Week Ahead
All eyes on the CPI report (Wed) after weaker employment data last week took the boil off Treasury yields and lessened the odds of a 25 basis point Fed rate hike at the September meeting from 67% to sub 50% (CME FedWatch). As a reminder, m/m CPI in June was -0.4% as energy prices declined and the m/m core CPI was flat, the first month without an increase since January, 2021. The question is whether businesses will pass through higher input prices to consumers as reflected in higher PPI figures that have spiked from the 3% y/y gains in Jan/Feb to the mid 5% range the past three months. Expectations are for a 2.4% core CPI increase, with a materially hotter reading likely undoing last week's relaxation of concerns for a Fed tightening. Retail sales (Fri) will provide a read on consumer spending with recent month acceleration (6.7% in June) a function of stronger auto and online spending (Amazon Prime day in June) as well as higher nominal prices for goods. Bond auction sizes for the 10 and 30-year are unchanged ($42B and $25B, respectively) but will test investor demand for long duration US debt in the face of still elevated/uncertain inflation and heavy US borrowing needs.
On the earnings front, AI adjacent vendors will be front and center to test the recent rebound in sentiment and share prices. Neo-cloud providers CRWV and NBIS will highlight general AI demand trends while AMAT, COHR, CRBS, CSCO and SMCI will speak to more specific verticals of wafer fab equipment, optical networking and enterprise technology budgets. ASTS and RKLB should have interesting commentary following the SPCX IPO as both are moving forward with commercial services following RKLB's proposed acquisition of IRDM. Retailers ONON, CAVA, DDS and TPR will spotlight different retail demand trends impacting consumer spending across apparel and restaurants with CAVA especially interesting following a strong same store sales gain in 1Q that was largely traffic driven suggesting strong brand momentum.
| Company | Date | EPS Est. |
|---|---|---|
| AST SpaceMobile, Inc. | Mon Aug 10 | ($0.26) |
| Rocket Lab Corp. | Mon Aug 10 | ($0.02) |
| Aramark | Tue Aug 11 | $0.76 |
| Cardinal Health, Inc. | Tue Aug 11 | $2.88 |
| On Holding AG | Tue Aug 11 | $0.50 |
| Cava Group, Inc. | Tue Aug 11 | $0.14 |
| CoreWeave, Inc. | Tue Aug 11 | ($1.07) |
| Coherent Corp. | Wed Aug 12 | $1.77 |
| Cisco Systems, Inc. | Wed Aug 12 | $1.14 |
| Dillard's, Inc. | Thu Aug 13 | $4.21 |
| YETI Holdings, Inc. | Thu Aug 13 | $0.87 |
| Applied Materials, Inc. | Thu Aug 13 | $3.67 |
| Tapestry, Inc. | Thu Aug 13 | $1.48 |
| Data Release | Date | Est. |
|---|---|---|
| Small Business Optimism Index | Tue Aug 11 | 96.8 |
| US Existing Home Sales | Tue Aug 11 | 4.06M |
| US Total Household Debt | Tue Aug 11 | N/A |
| US Consumer Price Index YoY | Wed Aug 12 | 3.40% |
| 10-Year Note Auction | Wed Aug 12 | N/A |
| US Producer Price Index YoY | Thu Aug 13 | 5.0% |
| 30-Year Bond Auction | Thu Aug 13 | N/A |
| US Retail Sales YoY | Fri Aug 14 | 6.0% |
| US Index of Consumer Sentiment | Fri Aug 14 | 54.60 |
Key Interest Rates — As of 8/7/26
| Rate | As of | Latest | 1 Mo Ago | 1 Mo % | 1 Yr Ago | 1 Yr % |
|---|---|---|---|---|---|---|
| 1 Month Treasury | 8/7/26 | 3.79% | 3.69% | 2.7% | 4.49% | -15.6% |
| 2 Year Treasury | 8/7/26 | 4.19% | 4.19% | 0.0% | 3.72% | 12.6% |
| 10 Year Treasury | 8/7/26 | 4.65% | 4.55% | 2.2% | 4.23% | 9.9% |
| 30 Year Mortgage | 8/6/26 | 6.69% | 6.43% | 4.0% | 6.72% | -0.4% |
| US Corporate AAA | 8/6/26 | 5.28% | 5.07% | 4.1% | 4.70% | 12.3% |
| US Corporate BBB | 8/6/26 | 5.57% | 5.36% | 3.9% | 5.13% | 8.6% |
| US Corporate CCC | 8/6/26 | 14.51% | 13.80% | 5.1% | 12.13% | 19.6% |
| Effective Federal Funds | 8/6/26 | 3.63% | 3.63% | 0.0% | 4.33% | -16.2% |
US Economy Indicators
| Indicator | As of | Latest | 1 Mo Ago | 1 Mo % | 1 Yr Ago | 1 Yr % |
|---|---|---|---|---|---|---|
| Consumer Sentiment | 7/31/26 | 55.20 | 49.50 | 11.5% | 61.70 | -10.5% |
| Unemployment Rate | 7/31/26 | 4.10% | 4.20% | -2.4% | 4.30% | -4.7% |
| Inflation Rate | 6/30/26 | 3.50% | 3.80% | -7.9% | 2.70% | 29.6% |
| Manufacturing PMI | 7/31/26 | 55.60 | 53.30 | 4.3% | 48.00 | 15.8% |
| Non Manufacturing PMI | 7/31/26 | 54.10 | 54.00 | 0.2% | 50.10 | 8.0% |
| Retail Sales | 6/30/26 | 666,056 | 657,830 | 1.3% | 621,374 | 7.2% |
| Building Permits | 6/30/26 | 1,367 | 1,423 | -3.9% | 1,399 | -2.3% |
Suggested Readings
- 1Institute For The Study of War: Hezbollah's Pivot to FPV Drones Requires Israeli Overmatch
- 2Data Center Approvals in Texas Halted Until Audits Completed, Gov. Greg Abbott Says
- 3OpenAI Asks Judge to Toss Apple's Trade Secrets Lawsuit
- 4El Nino Threatens Acute Hunger For 50 Million People, UN Warns
- 5China's Copper Smelting Grip Worries Veteran Metallurgist
Leadership Insight
“After a 25-year build-out, China now smelts roughly 60% of the world's copper, producing 12–13 million tonnes of refined metal a year across some 45 smelters, they are the Saudi Arabia of copper smelting. Over the same period, the US shrank its smelting fleet from roughly a dozen facilities to just two, and treatment charges have collapsed to near zero as Chinese capacity overwhelmed concentrate supply. Rebuilding Western smelting capability would require billions of dollars and close to a decade per project, while political will and capital remain uncertain. That processing dependency keeps the copper supply chain in a state of structural tension, ready to snap upward on any new disruption.”
Stocks to Watch
For our full list of Stocks To Consider, contact Patrick Mullin at pmullin@timberpointcapital.com
U.S. equities rose sharply as strong corporate earnings, renewed enthusiasm for AI-related shares, lower oil prices, and softer labor data drew investors back into risk assets. The Nasdaq led with a 5.2% gain, followed by the SPX at 3.6%, the R2K at 3.5%, and the DJIA at 3.0%. The SPX and DJIA closed at record highs while the Nasdaq posted its strongest week since April. Nine of eleven SPX sectors finished higher, led by Information Technology (XLK), up 7.0%, and Materials (XLB), up 5.6%. Energy (XLE) fell 3.6% on lower oil prices and Utilities (XLU) declined 1.4%. Technology rebounded as AI spending showed signs of translating into revenue growth across software, cloud infrastructure, and semiconductors. Materials benefited from price gains in gold, silver, and copper. All style segments were positive for the week with Small and Large Growth leading the way, up 6% and 5%, respectively.
Labor data were the week's most important macro catalyst. Nonfarm payrolls unexpectedly declined by 23K in July versus expectations for an increase of roughly 80K, while June payroll growth was revised to 20K from 57K and May to 63K from 129K. Job losses were focused in the government sector (50K) as private payrolls expanded by 30K despite a 19K loss from the retail trade segment. The unemployment rate slipped to 4.1%, partly because labor-force participation fell to 61.4%, the lowest in more than five years. ADP reported 44K private-sector jobs in July, below estimates of 70K, and JOLTS job openings eased slightly to 7.36M, a slight downtick versus the prior two months. The softer employment picture reduced the probability of a September Fed rate increase to roughly 42% by Friday from about 71% the prior week (CME Fedwatch).
Business activity remained comparatively strong. The ISM Manufacturing Index rose to 55.6 in July, its highest reading since May 2022, while the ISM Services Index held at 54.1. New orders remained firm, but the services employment component moved back into contraction and the prices index rose to 70.3, underscoring the tension between slowing hiring and still-elevated input costs. The Fed continues to deal with a slightly more complicated inflation-growth mix heading into this week's CPI and PPI reports.
Treasury yields declined on the softer employment data and hopes for progress on reopening the Strait of Hormuz which helped lower crude prices. The 2-year Treasury yield declined about 9 basis points to 4.20%, the 10-year fell about 9 basis points to 4.65%, and the 30-year eased roughly 7 basis points to 5.20%. Oil fell 8.7% while gold rallied 7.5%, silver gained 10.4% and copper rallied 2% after having been up as much as 5% earlier in the week. The USD weakened following the payroll report.
| Asset Class | 1 Wk | 1 Mo | 3 Mo | YTD | 1 Yr | 3 Yr | 5 Yr |
|---|---|---|---|---|---|---|---|
| S&P 500 | 3.59% | 3.44% | 6.04% | 14.09% | 23.83% | 21.35% | 13.44% |
| Dow Jones Industrials Average | 2.96% | 2.13% | 9.39% | 13.43% | 24.94% | 17.16% | 11.04% |
| NASDAQ | 5.19% | 3.39% | 3.58% | 15.22% | 26.41% | 24.87% | 13.29% |
| S&P MidCap 400 | 3.38% | 3.08% | 5.88% | 18.43% | 26.08% | 14.57% | 9.08% |
| Russell 2000 | 3.52% | 1.80% | 7.18% | 23.06% | 38.71% | 17.30% | 7.65% |
| Russell Micro Cap | 5.72% | 1.68% | 8.39% | 26.75% | 53.58% | 22.66% | 7.88% |
| Sector | 1Wk | YTD |
|---|---|---|
| 3.25% | 0.78% | |
| 1.16% | 6.07% | |
| 4.82% | 17.51% | |
| -0.20% | 13.19% |
| Sector | 1Wk | YTD |
|---|---|---|
| 2.78% | -4.95% | |
| -3.44% | 30.36% | |
| 2.97% | 20.00% | |
| 7.20% | 30.88% |
| Sector | 1Wk | YTD |
|---|---|---|
| 0.08% | 10.96% | |
| 1.93% | 7.94% | |
| -1.67% | 3.52% |
| Style | 1 Wk | 1 Mo | 3 Mo | YTD | 1 Yr | 3 Yr | 5 Yr |
|---|---|---|---|---|---|---|---|
| Large Growth | 4.94% | 4.08% | 4.00% | 10.19% | 18.31% | 24.09% | 13.07% |
| Large Blend | 3.67% | 3.42% | 6.20% | 13.83% | 23.34% | 21.54% | 13.00% |
| Large Value | 2.04% | 2.17% | 9.52% | 18.75% | 29.59% | 18.02% | 12.53% |
| Mid Growth | 3.60% | 1.80% | 5.35% | 10.10% | 7.12% | 14.79% | 5.49% |
| Mid Blend | 2.21% | 2.61% | 7.23% | 14.84% | 18.09% | 15.71% | 8.04% |
| Mid Value | 1.19% | 3.22% | 8.67% | 18.04% | 26.36% | 15.93% | 10.18% |
| Small Growth | 5.98% | 1.79% | 5.75% | 19.71% | 29.29% | 16.52% | 5.22% |
| Small Blend | 3.73% | 2.56% | 7.05% | 19.45% | 29.02% | 15.91% | 8.05% |
| Small Value | 2.14% | 3.12% | 8.00% | 19.21% | 28.74% | 15.39% | 10.03% |
All eyes on the CPI report (Wed) after weaker employment data last week took the boil off Treasury yields and lessened the odds of a 25 basis point Fed rate hike at the September meeting from 67% to sub 50% (CME FedWatch). As a reminder, m/m CPI in June was -0.4% as energy prices declined and the m/m core CPI was flat, the first month without an increase since January, 2021. The question is whether businesses will pass through higher input prices to consumers as reflected in higher PPI figures that have spiked from the 3% y/y gains in Jan/Feb to the mid 5% range the past three months. Expectations are for a 2.4% core CPI increase, with a materially hotter reading likely undoing last week's relaxation of concerns for a Fed tightening. Retail sales (Fri) will provide a read on consumer spending with recent month acceleration (6.7% in June) a function of stronger auto and online spending (Amazon Prime day in June) as well as higher nominal prices for goods. Bond auction sizes for the 10 and 30-year are unchanged ($42B and $25B, respectively) but will test investor demand for long duration US debt in the face of still elevated/uncertain inflation and heavy US borrowing needs.
On the earnings front, AI adjacent vendors will be front and center to test the recent rebound in sentiment and share prices. Neo-cloud providers CRWV and NBIS will highlight general AI demand trends while AMAT, COHR, CRBS, CSCO and SMCI will speak to more specific verticals of wafer fab equipment, optical networking and enterprise technology budgets. ASTS and RKLB should have interesting commentary following the SPCX IPO as both are moving forward with commercial services following RKLB's proposed acquisition of IRDM. Retailers ONON, CAVA, DDS and TPR will spotlight different retail demand trends impacting consumer spending across apparel and restaurants with CAVA especially interesting following a strong same store sales gain in 1Q that was largely traffic driven suggesting strong brand momentum.
| Company | Date | EPS Est. |
|---|---|---|
| AST SpaceMobile, Inc. | Mon Aug 10 | ($0.26) |
| Rocket Lab Corp. | Mon Aug 10 | ($0.02) |
| Aramark | Tue Aug 11 | $0.76 |
| Cardinal Health, Inc. | Tue Aug 11 | $2.88 |
| On Holding AG | Tue Aug 11 | $0.50 |
| Cava Group, Inc. | Tue Aug 11 | $0.14 |
| CoreWeave, Inc. | Tue Aug 11 | ($1.07) |
| Coherent Corp. | Wed Aug 12 | $1.77 |
| Cisco Systems, Inc. | Wed Aug 12 | $1.14 |
| Dillard's, Inc. | Thu Aug 13 | $4.21 |
| YETI Holdings, Inc. | Thu Aug 13 | $0.87 |
| Applied Materials, Inc. | Thu Aug 13 | $3.67 |
| Tapestry, Inc. | Thu Aug 13 | $1.48 |
| Data Release | Date | Est. |
|---|---|---|
| Small Business Optimism Index | Tue Aug 11 | 96.8 |
| US Existing Home Sales | Tue Aug 11 | 4.06M |
| US Total Household Debt | Tue Aug 11 | N/A |
| US Consumer Price Index YoY | Wed Aug 12 | 3.40% |
| 10-Year Note Auction | Wed Aug 12 | N/A |
| US Producer Price Index YoY | Thu Aug 13 | 5.0% |
| 30-Year Bond Auction | Thu Aug 13 | N/A |
| US Retail Sales YoY | Fri Aug 14 | 6.0% |
| US Index of Consumer Sentiment | Fri Aug 14 | 54.60 |
European equities advanced for a fourth consecutive week as strong corporate earnings and lower energy prices supported risk appetite. The STOXX Europe 600 gained 1.7%, Germany's DAX rose 2.7%, France's CAC 40 advanced 2.4% and the UK's FTSE 100 gained 0.3%. Technology and materials-related shares were among the stronger groups as investors responded to revenue beats and higher copper prices. Eurozone Services PMI moved to 51.7, its highest level in five months, but was uneven across geographies as the two largest economies, France and Germany, remained in contractionary territory (<50.0), despite small upticks in June.
Japanese equities finished higher, with the Nikkei 225 gaining 1.9% and the TOPIX rising 1.8%. Markets continued to assess the impact of the prior week's coordinated U.S.-Japan currency intervention, while expectations remained elevated that the BoJ could tighten policy again later this year. The yen weakened back through JPY 158 per USD after its intervention-driven rebound, and the 10-year JGB yield finished near 2.79%. Positive semiconductor earnings and lower oil prices helped offset early-week currency volatility.
Mainland Chinese equities outperformed as technology and semiconductor shares rallied. The Shanghai Composite gained 2.8% and the CSI 300 rose 2.3%. Investors remained enthusiastic about lower-cost domestic AI development and optical-networking demand, although private-sector PMI data pointed to slower activity as manufacturing eased to 50.9 in July and services declined to 50.4. Exports remained strong, rising 23.9% y/y in USD terms, while imports increased 27.5%. In Hong Kong, the Hang Seng fell 0.8%.
| Region | 1 Wk | 1 Mo | 3 Mo | YTD | 1 Yr | 3 Yr | 5 Yr |
|---|---|---|---|---|---|---|---|
| MSCI ACWI | 2.85% | 2.87% | 4.92% | 14.81% | 25.31% | 20.78% | 11.77% |
| MSCI ACWI ex USA | 1.49% | 1.90% | 2.53% | 15.77% | 28.06% | 19.07% | 9.32% |
| MSCI Emerging Markets | -0.43% | -1.56% | -3.15% | 19.53% | 33.93% | 20.32% | 7.68% |
| MSCI Europe Stock | 2.17% | 3.18% | 6.11% | 11.92% | 23.40% | 17.51% | 9.71% |
| MSCI Asia Pacific Stock | 0.44% | 0.02% | -0.39% | 20.34% | 32.09% | 20.13% | 8.68% |
| MSCI Latin America Stock | -1.51% | 2.66% | -3.96% | 14.15% | 37.31% | 13.22% | 10.74% |
| Rate | Latest | 1 Mo Ago | 1 Mo % | 1 Yr Ago | 1 Yr % |
|---|---|---|---|---|---|
| 1 Month Treasury | 3.79% | 3.69% | 2.7% | 4.49% | -15.6% |
| 2 Year Treasury | 4.19% | 4.19% | 0.0% | 3.72% | 12.6% |
| 10 Year Treasury | 4.65% | 4.55% | 2.2% | 4.23% | 9.9% |
| 30 Year Mortgage | 6.69% | 6.43% | 4.0% | 6.72% | -0.4% |
| US Corporate AAA | 5.28% | 5.07% | 4.1% | 4.70% | 12.3% |
| US Corporate BBB | 5.57% | 5.36% | 3.9% | 5.13% | 8.6% |
| US Corporate CCC | 14.51% | 13.80% | 5.1% | 12.13% | 19.6% |
| Effective Federal Funds | 3.63% | 3.63% | 0.0% | 4.33% | -16.2% |
| Indicator | Latest | 1 Mo Ago | 1 Mo % | 1 Yr Ago | 1 Yr % |
|---|---|---|---|---|---|
| Consumer Sentiment | 55.20 | 49.50 | 11.5% | 61.70 | -10.5% |
| Unemployment Rate | 4.10% | 4.20% | -2.4% | 4.30% | -4.7% |
| Inflation Rate | 3.50% | 3.80% | -7.9% | 2.70% | 29.6% |
| Manufacturing PMI | 55.60 | 53.30 | 4.3% | 48.00 | 15.8% |
| Non Manufacturing PMI | 54.10 | 54.00 | 0.2% | 50.10 | 8.0% |
| Retail Sales | 666,056 | 657,830 | 1.3% | 621,374 | 7.2% |
| Building Permits | 1,367 | 1,423 | -3.9% | 1,399 | -2.3% |
ABNB has been trading a range between $120 and $170 for the better part of the past 3 years. Recent action has seen it move above the high end of the range on larger than normal volume suggesting that the advance has staying power. We believe ABNB can attempt to move to the $200 level before it meets intermediate resistance. We would buy shares on the breakout and more if/when it retraces to $170 support.
“After a 25-year build-out, China now smelts roughly 60% of the world's copper, producing 12–13 million tonnes of refined metal a year across some 45 smelters, they are the Saudi Arabia of copper smelting. Over the same period, the US shrank its smelting fleet from roughly a dozen facilities to just two, and treatment charges have collapsed to near zero as Chinese capacity overwhelmed concentrate supply. Rebuilding Western smelting capability would require billions of dollars and close to a decade per project, while political will and capital remain uncertain. That processing dependency keeps the copper supply chain in a state of structural tension, ready to snap upward on any new disruption.”
For our full list of Stocks To Consider, contact Patrick Mullin at pmullin@timberpointcapital.com
©2020 YCharts, Inc. All Rights Reserved. YCharts, Inc. ("YCharts") is not registered with the U.S. Securities and Exchange Commission as an investment adviser, broker-dealer or in any other capacity, and does not purport to provide investment advice or make investment recommendations. This report has been generated through application of the analytical tools and data provided through ycharts.com and is intended solely to assist you or your investment or other adviser(s) in conducting investment research.
All data, statistics and charts are courtesy of YCharts unless otherwise noted. Investment Advice is offered through Fortis Capital Advisors, LLC, 7301 Mission Road, Suite 326, Prairie Village, KS 66208.
While reasonable efforts were used to obtain information from sources believed to be reliable, Fortis Capital Advisors, LLC makes no representation that the information or opinions contained in this material are accurate, reliable, or complete. All information and opinions are subject to change without notice. You should not construe this report as an offer to buy or sell, as a solicitation of an offer to buy or sell, or as a recommendation to buy, sell, hold or trade, any security or other financial instrument.
Past performance is not indicative of future results. Investing involves risk, including the possible loss of principal. The information contained herein is provided for informational purposes only and should not be construed as investment, tax, or legal advice. Recipients should consult their own advisers before making any investment decisions.
Source: Timber Point Capital Management. Powered by Fortis Capital Advisors. Investment Advice is offered through Fortis Capital Advisors, LLC, 7301 Mission Road, Suite 326, Prairie Village, KS 66208. All rights reserved.