
The Week That Was
U.S. equities finished lower as rising long-term Treasury yields and ongoing U.S.-Iran tension pressured risk appetite. The Nasdaq fell the most, down 2.1%, followed by the R2K at -1.6%, the SPX at -1.4%, and the DJIA at -0.8%. Sector performance was mixed as Healthcare (XLV) gained 4.3% on the back of the MRK/MRNA cancer vaccine news while Energy (XLE) rose 2.8% on higher oil prices. Among declining sectors Information Technology (XLK) fell 3.5%, Industrials 3.3%, Utilities 3.0%, and Communication Services 1.5%. Growth stocks across the market cap spectrum again performed worse than their blend or value counterparts.
The 30-year Treasury yield was the news of the week as it reached its highest level since 2007 with investors focused on heavy federal borrowing, rising term premium, and a surge in corporate bond issuance linked to AI capital spending. Treasury's decision to at least double the size of long-duration debt buybacks produced a sharp midweek rally in bonds, but much of the move later reversed as investors questioned whether the program could offset the underlying fiscal and supply pressures.
Fed minutes added to the uncertainty. Participants generally expected inflation to moderate through the remainder of the year, but continued to view risks as skewed to the upside and indicated that further tightening could be necessary if inflation fails to cool. Market pricing moved back toward roughly a 40% probability of a September rate increase (CME FedWatch).
Economic data remained resilient as the S&P Global Flash Composite PMI rose to 56.0 in August, the strongest reading since April 2022, led by a jump in services activity to 56.8. Employment growth in the survey was the strongest since January 2025, while selling-price inflation slowed even as input costs remained elevated. Housing remained a weak spot as July housing starts fell more than 12% m/m to a 1.239M annualized rate and pending home sales declined 2.3%.
Commodities finally caught a bid beyond oil, which rose more than 5% for a second consecutive strong week as the Strait of Hormuz dispute remained unresolved. However, gold gained 5.6% and silver rose 7.5% amid fiscal concerns and currency volatility, while the USD weakened.
U.S. Equity Market Summary — As of 8/21/26
| Asset Class | 1 Wk | 1 Mo | 3 Mo | YTD | 1 Yr | 3 Yr | 5 Yr |
|---|---|---|---|---|---|---|---|
| S&P 500 | -1.39% | +2.30% | +3.36% | +12.95% | +21.90% | +21.98% | +13.17% |
| Dow Jones Industrials Average | -0.85% | +2.14% | +6.36% | +11.96% | +20.95% | +17.70% | +10.77% |
| NASDAQ | -2.05% | +1.39% | -0.29% | +13.07% | +24.82% | +25.56% | +13.03% |
| S&P MidCap 400 | -2.46% | +1.33% | +5.49% | +16.83% | +22.53% | +15.79% | +9.11% |
| Russell 2000 | -1.65% | +1.13% | +6.46% | +22.48% | +34.34% | +19.20% | +8.32% |
| Russell Micro Cap | -1.31% | +2.72% | +7.05% | +26.25% | +46.58% | +24.76% | +8.76% |
U.S. Sector Summary — As of 8/21/26
| Cyclical Sectors | 1 Wk | 1 Mo | 3 Mo | YTD | 1 Yr | 3 Yr | 5 Yr |
|---|---|---|---|---|---|---|---|
| Consumer Cyclical | -0.15% | +2.74% | -0.37% | -0.77% | +5.14% | +13.70% | +6.72% |
| Financials | -1.17% | +2.44% | +11.50% | +5.85% | +10.75% | +21.08% | +10.70% |
| Materials | +1.90% | +6.87% | +7.44% | +19.02% | +20.61% | +11.94% | +7.13% |
| Real Estate | -0.42% | -0.27% | +2.18% | +13.44% | +11.86% | +11.63% | +2.53% |
| Sensitive Sectors | 1 Wk | 1 Mo | 3 Mo | YTD | 1 Yr | 3 Yr | 5 Yr |
|---|---|---|---|---|---|---|---|
| Comm. Services | -1.37% | +1.25% | -3.79% | -4.82% | +2.80% | +20.69% | +7.23% |
| Energy | +2.79% | +8.79% | +8.39% | +44.28% | +51.90% | +16.64% | +27.15% |
| Industrials | -3.36% | +0.89% | +5.96% | +16.81% | +21.15% | +21.04% | +13.62% |
| Technology | -3.53% | +1.40% | +2.76% | +27.63% | +42.34% | +30.54% | +19.57% |
| Defensive Sectors | 1 Wk | 1 Mo | 3 Mo | YTD | 1 Yr | 3 Yr | 5 Yr |
|---|---|---|---|---|---|---|---|
| Consumer Defensive | -0.12% | +2.30% | +2.28% | +12.10% | +7.17% | +8.75% | +6.16% |
| Health Care | +4.33% | +8.97% | +18.38% | +13.76% | +29.64% | +11.16% | +6.82% |
| Utilities | -3.48% | -4.79% | -4.35% | +1.52% | +2.72% | +14.04% | +7.28% |
US Equity Style Summary — As of 8/21/26
| Equity Style | 1 Wk | 1 Mo | 3 Mo | YTD | 1 Yr | 3 Yr | 5 Yr |
|---|---|---|---|---|---|---|---|
| Large Growth | -2.10% | +1.55% | +0.09% | +7.82% | +16.86% | +24.20% | +12.59% |
| Large Blend | -1.44% | +2.35% | +3.51% | +12.68% | +21.59% | +22.19% | +12.76% |
| Large Value | -0.51% | +3.53% | +8.84% | +19.79% | +27.71% | +19.49% | +12.68% |
| Mid Growth | -2.68% | +2.75% | +5.88% | +9.85% | +8.53% | +16.23% | +5.64% |
| Mid Blend | -1.78% | +3.07% | +7.56% | +15.21% | +17.99% | +17.48% | +8.26% |
| Mid Value | -1.11% | +3.32% | +8.83% | +18.90% | +24.91% | +17.96% | +10.42% |
| Small Growth | -2.02% | +2.96% | +4.39% | +18.99% | +26.78% | +18.07% | +5.76% |
| Small Blend | -1.43% | +2.62% | +6.71% | +18.97% | +26.05% | +17.63% | +8.50% |
| Small Value | -0.99% | +2.38% | +8.47% | +18.90% | +25.42% | +17.25% | +10.41% |
International Equity Market Summary — As of 8/21/26
European equities moved lower on the fear of rising global bond yields spurred on by higher oil prices as the Iran/US wars which seemingly has no end in sight. The STOXX Europe 600 fell 0.6%, Germany's DAX declined 1.2%, France's CAC 40 fell 1.8%, while the UK's FTSE 100 gained 0.6%. Eurozone flash composite PMI improved to 52.1, while Germany's manufacturing output rose to its strongest level in more than four years.
Japanese equities declined sharply, with the Nikkei 225 down 3.9% and the TOPIX down 3.1%. Technology and semiconductor shares were pressured by higher global yields and renewed risk aversion. The 10-year JGB yield briefly reached a 30-year high near 2.93% before ending around 2.88%. Japan's second-quarter GDP slowed to 1.1% annualized, below expectations, while July core inflation accelerated to 1.8% y/y, reinforcing expectations for another BoJ rate increase.
Mainland Chinese equities weakened with the Shanghai Composite down 0.6% and the CSI 300 declining 1.0% as July data pointed to a slowdown. Industrial production slowed to 4.5% y/y, retail sales growth eased to 0.6%, fixed-asset investment contracted 6.7% through July, and real-estate investment fell 19.2%. Authorities continued to ease housing restrictions, but the data increased pressure for additional fiscal support. Hong Kong's Hang Seng Index was higher by 3.6%.
| Region | 1 Wk | 1 Mo | 3 Mo | YTD | 1 Yr | 3 Yr | 5 Yr |
|---|---|---|---|---|---|---|---|
| MSCI ACWI | -0.91% | +3.07% | +4.28% | +14.64% | +24.06% | +22.05% | +11.97% |
| MSCI ACWI ex USA | +0.09% | +4.33% | +5.45% | +17.40% | +27.79% | +21.38% | +10.23% |
| MSCI Emerging Markets | +1.24% | +4.33% | +3.46% | +24.22% | +38.90% | +24.18% | +9.73% |
| MSCI Europe Stock | +0.25% | +4.31% | +6.81% | +12.27% | +20.70% | +18.88% | +9.97% |
| MSCI Asia Pacific Stock | -0.31% | +4.07% | +4.38% | +23.16% | +33.52% | +23.47% | +10.17% |
| MSCI Latin America Stock | +3.03% | +0.43% | -0.29% | +14.08% | +36.75% | +14.86% | +11.76% |
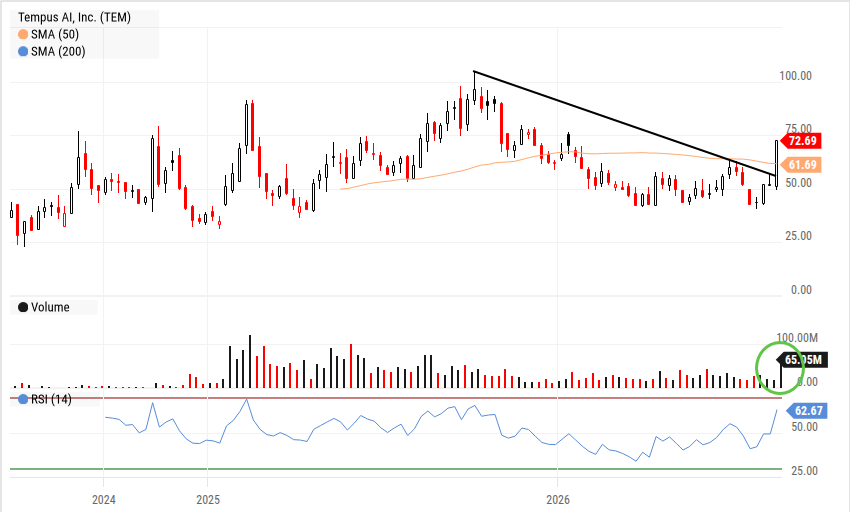
Chart of the Week — 8/24/26
TEM has been in a downtrend for most of the past year since peaking slightly over $100 in October, 2025. It has strong support in the $40 range where it has bottomed multiple times over the past few months. Last week saw a gap higher that broke its downtrend line on a big spike in volume. We believe the stock is poised to challenge old highs near $100.
The Week Ahead
It may be August but investors face a busy week of economic data, Fed commentary and earnings that should provide important signals on inflation and the durability of the AI-led investment cycle. The most important macro release will be July PCE inflation (Wed), the Fed's preferred measure of prices. After softer CPI and PPI readings, investors will be looking for confirmation that core inflation is continuing to moderate although consensus estimates are for headline and core PCE to remain flat on a y/y basis at 3.7% and 3.3%, respectively. A hotter-than-expected result would likely revive concerns that the Fed may still need to tighten policy to get to its 2% target, a message that long-term Treasury yields started to give anew last week.
Wednesday will also bring the second estimate of Q2 GDP, durable goods orders and capital-goods data, providing a read on whether strong business investment is continuing to offset softer housing and consumer activity. Consumer confidence and new home sales (Tues) are likely to remain weak while Friday's preliminary annual non-farm payroll benchmark revision could be especially important after recent downward revisions to monthly job growth.
The biggest earnings report will no doubt be NVDA (Wed). Investors will parse a number of different datapoints including Blackwell and Rubin demand, gross margins, supply constraints and management's commentary on hyperscaler capital spending plans. CRM, CRWD, OKTA and SNPS will provide a broader look at enterprise software, cybersecurity and AI monetization, while MRVL (Thurs) should offer another read on broad AI spend as their product portfolio includes AI accelerators, optical connectivity and other data-center networking components. DG and DLTR will help gauge the health of lower-income consumers and the degree of trade-down behavior following softer recent retail data. DKS, ANF, KSS, BBY and GAP will all speak to different facets of consumer spending.
Fed Chair Kevin Warsh's Jackson Hole speech (Fri) may ultimately prove the week's most important policy event. Markets will be focused on his assessment of inflation, financial conditions and long-term yields, as well as whether the Fed still sees a case for another rate increase. Meanwhile, developments surrounding the Strait of Hormuz and any further Treasury policy announcements remain important considerations.
| Company | Date | EPS Est. |
|---|---|---|
| Dick's Sporting Goods, Inc. | Tue Aug 25 | $2.90 |
| Box, Inc. | Tue Aug 25 | $0.39 |
| HEICO Corp. | Tue Aug 25 | $1.57 |
| Intuit, Inc. | Tue Aug 25 | $4.02 |
| Zoom Communications, Inc. | Tue Aug 25 | $1.50 |
| Abercrombie & Fitch Co. | Wed Aug 26 | $2.82 |
| Kohl's Corp. | Wed Aug 26 | $0.05 |
| Agilent Technologies, Inc. | Wed Aug 26 | $1.71 |
| NVIDIA Corp. | Wed Aug 26 | $2.37 |
| Synopsys, Inc. | Wed Aug 26 | $4.00 |
| Best Buy Co., Inc. | Thu Aug 27 | $1.40 |
| Dollar General Corp. | Thu Aug 27 | $1.38 |
| Gap, Inc. | Thu Aug 27 | $0.80 |
| Marvell Technology, Inc. | Thu Aug 27 | $1.07 |
| Ulta Beauty, Inc. | Thu Aug 27 | $5.80 |
| Data Release | Date | Est. |
|---|---|---|
| Chicago Fed National Activity Index | Mon Aug 24 | 0.1 |
| Case-Shiller Composite 20 Home Price Index YoY | Tue Aug 25 | 2.4% |
| US New Single Family Houses Sold | Tue Aug 25 | 620.0K |
| Conference Board Consumer Confidence | Tue Aug 25 | 90.9 |
| US PCE Price Index YoY | Wed Aug 26 | 1.0% |
| US Durable Goods ex-Transportation New Orders MoM | Wed Aug 26 | 0.3% |
| Jackson Hole Economic Policy Symposium | Thu Aug 27 | N/A |
| Chicago PMI | Fri Aug 28 | 56.1 |
| US Index of Consumer Sentiment | Fri Aug 28 | 54.60 |
Key Interest Rates — As of 8/21/26
| Rate | As of | Latest | 1 Mo Ago | 1 Mo % | 1 Yr Ago | 1 Yr % |
|---|---|---|---|---|---|---|
| 1 Month Treasury | 8/21/26 | 3.80% | 3.75% | +1.3% | 4.49% | -15.4% |
| 2 Year Treasury | 8/21/26 | 4.24% | 4.26% | -0.5% | 3.79% | +11.9% |
| 10 Year Treasury | 8/21/26 | 4.74% | 4.63% | +2.4% | 4.33% | +9.5% |
| 30 Year Mortgage | 8/20/26 | 6.65% | 6.55% | +1.5% | 6.58% | +1.1% |
| US Corporate AAA | 8/20/26 | 5.30% | 5.22% | +1.5% | 4.72% | +12.3% |
| US Corporate BBB | 8/20/26 | 5.59% | 5.50% | +1.6% | 5.13% | +9.0% |
| US Corporate CCC | 8/20/26 | 14.61% | 13.98% | +4.5% | 11.93% | +22.5% |
| Effective Federal Funds | 8/20/26 | 3.63% | 3.63% | 0.0% | 4.33% | -16.2% |
US Economy Indicators
| Indicator | As of | Latest | 1 Mo Ago | 1 Mo % | 1 Yr Ago | 1 Yr % |
|---|---|---|---|---|---|---|
| Consumer Sentiment | 7/31/26 | 55.20 | 49.50 | +11.5% | 61.70 | -10.5% |
| Unemployment Rate | 7/31/26 | 4.10% | 4.20% | -2.4% | 4.30% | -4.7% |
| Inflation Rate | 7/31/26 | 3.40% | 3.50% | -2.9% | 2.70% | +25.9% |
| Manufacturing PMI | 7/31/26 | 55.60 | 53.30 | +4.3% | 48.00 | +15.8% |
| Non Manufacturing PMI | 7/31/26 | 54.10 | 54.00 | +0.2% | 50.10 | +8.0% |
| Retail Sales | 7/31/26 | 660,047 | 665,054 | -0.8% | 628,581 | +5.0% |
| Building Permits | 7/31/26 | 1,443 | 1,374 | +5.0% | 1,400 | +3.1% |
Suggested Readings
- 1Institute For The Study of War: Iran Update Special Report, August 21, 2026
- 2Iran's Steel Silk Road Breaks the Maritime Siege
- 3What the Treasury's Buyback Surprise Says About the Bond Market
- 4What Does Unitree Robotics' IPO Mean for the Humanoid Industry?
- 5Merck/Moderna Cancer Vaccine Gives a Shot in the Arm to Sequencing Companies, Too
Leadership Insight
“We, no doubt, and it sort of states the obvious of seeing some incremental pressure on the consumer relative to the beginning of the year with higher fuel prices. As you go through month by month in the last quarter, you can tell when fuel prices increase and got above $4, and perhaps there's a psychological impact to that, that there are choices that consumers are making. So June was a little more obvious as we look at the quarter in terms of customers making trade-offs. And it's why we have leaned so heavily into lower prices.”
Stocks to Watch
For our full list of Stocks To Consider, contact Patrick Mullin at pmullin@timberpointcapital.com
U.S. equities finished lower as rising long-term Treasury yields and ongoing U.S.-Iran tension pressured risk appetite. The Nasdaq fell the most, down 2.1%, followed by the R2K at -1.6%, the SPX at -1.4%, and the DJIA at -0.8%. Sector performance was mixed as Healthcare (XLV) gained 4.3% on the back of the MRK/MRNA cancer vaccine news while Energy (XLE) rose 2.8% on higher oil prices. Among declining sectors Information Technology (XLK) fell 3.5%, Industrials 3.3%, Utilities 3.0%, and Communication Services 1.5%. Growth stocks across the market cap spectrum again performed worse than their blend or value counterparts.
The 30-year Treasury yield was the news of the week as it reached its highest level since 2007 with investors focused on heavy federal borrowing, rising term premium, and a surge in corporate bond issuance linked to AI capital spending. Treasury's decision to at least double the size of long-duration debt buybacks produced a sharp midweek rally in bonds, but much of the move later reversed as investors questioned whether the program could offset the underlying fiscal and supply pressures.
Fed minutes added to the uncertainty. Participants generally expected inflation to moderate through the remainder of the year, but continued to view risks as skewed to the upside and indicated that further tightening could be necessary if inflation fails to cool. Market pricing moved back toward roughly a 40% probability of a September rate increase (CME FedWatch).
Economic data remained resilient as the S&P Global Flash Composite PMI rose to 56.0 in August, the strongest reading since April 2022, led by a jump in services activity to 56.8. Employment growth in the survey was the strongest since January 2025, while selling-price inflation slowed even as input costs remained elevated. Housing remained a weak spot as July housing starts fell more than 12% m/m to a 1.239M annualized rate and pending home sales declined 2.3%.
Commodities finally caught a bid beyond oil, which rose more than 5% for a second consecutive strong week as the Strait of Hormuz dispute remained unresolved. However, gold gained 5.6% and silver rose 7.5% amid fiscal concerns and currency volatility, while the USD weakened.
| Asset Class | 1 Wk | 1 Mo | 3 Mo | YTD | 1 Yr | 3 Yr | 5 Yr |
|---|---|---|---|---|---|---|---|
| S&P 500 | -1.39% | +2.30% | +3.36% | +12.95% | +21.90% | +21.98% | +13.17% |
| Dow Jones Industrials Average | -0.85% | +2.14% | +6.36% | +11.96% | +20.95% | +17.70% | +10.77% |
| NASDAQ | -2.05% | +1.39% | -0.29% | +13.07% | +24.82% | +25.56% | +13.03% |
| S&P MidCap 400 | -2.46% | +1.33% | +5.49% | +16.83% | +22.53% | +15.79% | +9.11% |
| Russell 2000 | -1.65% | +1.13% | +6.46% | +22.48% | +34.34% | +19.20% | +8.32% |
| Russell Micro Cap | -1.31% | +2.72% | +7.05% | +26.25% | +46.58% | +24.76% | +8.76% |
| Sector | 1Wk | YTD |
|---|---|---|
| -0.15% | -0.77% | |
| -1.17% | +5.85% | |
| +1.90% | +19.02% | |
| -0.42% | +13.44% |
| Sector | 1Wk | YTD |
|---|---|---|
| -1.37% | -4.82% | |
| +2.79% | +44.28% | |
| -3.36% | +16.81% | |
| -3.53% | +27.63% |
| Sector | 1Wk | YTD |
|---|---|---|
| -0.12% | +12.10% | |
| +4.33% | +13.76% | |
| -3.48% | +1.52% |
| Style | 1 Wk | 1 Mo | 3 Mo | YTD | 1 Yr | 3 Yr | 5 Yr |
|---|---|---|---|---|---|---|---|
| Large Growth | -2.10% | +1.55% | +0.09% | +7.82% | +16.86% | +24.20% | +12.59% |
| Large Blend | -1.44% | +2.35% | +3.51% | +12.68% | +21.59% | +22.19% | +12.76% |
| Large Value | -0.51% | +3.53% | +8.84% | +19.79% | +27.71% | +19.49% | +12.68% |
| Mid Growth | -2.68% | +2.75% | +5.88% | +9.85% | +8.53% | +16.23% | +5.64% |
| Mid Blend | -1.78% | +3.07% | +7.56% | +15.21% | +17.99% | +17.48% | +8.26% |
| Mid Value | -1.11% | +3.32% | +8.83% | +18.90% | +24.91% | +17.96% | +10.42% |
| Small Growth | -2.02% | +2.96% | +4.39% | +18.99% | +26.78% | +18.07% | +5.76% |
| Small Blend | -1.43% | +2.62% | +6.71% | +18.97% | +26.05% | +17.63% | +8.50% |
| Small Value | -0.99% | +2.38% | +8.47% | +18.90% | +25.42% | +17.25% | +10.41% |
It may be August but investors face a busy week of economic data, Fed commentary and earnings that should provide important signals on inflation and the durability of the AI-led investment cycle. The most important macro release will be July PCE inflation (Wed), the Fed's preferred measure of prices. After softer CPI and PPI readings, investors will be looking for confirmation that core inflation is continuing to moderate although consensus estimates are for headline and core PCE to remain flat on a y/y basis at 3.7% and 3.3%, respectively. A hotter-than-expected result would likely revive concerns that the Fed may still need to tighten policy to get to its 2% target, a message that long-term Treasury yields started to give anew last week.
Wednesday will also bring the second estimate of Q2 GDP, durable goods orders and capital-goods data, providing a read on whether strong business investment is continuing to offset softer housing and consumer activity. Consumer confidence and new home sales (Tues) are likely to remain weak while Friday's preliminary annual non-farm payroll benchmark revision could be especially important after recent downward revisions to monthly job growth.
The biggest earnings report will no doubt be NVDA (Wed). Investors will parse a number of different datapoints including Blackwell and Rubin demand, gross margins, supply constraints and management's commentary on hyperscaler capital spending plans. CRM, CRWD, OKTA and SNPS will provide a broader look at enterprise software, cybersecurity and AI monetization, while MRVL (Thurs) should offer another read on broad AI spend. DG and DLTR will help gauge the health of lower-income consumers. DKS, ANF, KSS, BBY and GAP will all speak to different facets of consumer spending.
Fed Chair Kevin Warsh's Jackson Hole speech (Fri) may ultimately prove the week's most important policy event. Markets will be focused on his assessment of inflation, financial conditions and long-term yields, as well as whether the Fed still sees a case for another rate increase. Meanwhile, developments surrounding the Strait of Hormuz and any further Treasury policy announcements remain important considerations.
| Company | Date | EPS Est. |
|---|---|---|
| Dick's Sporting Goods, Inc. | Tue Aug 25 | $2.90 |
| Box, Inc. | Tue Aug 25 | $0.39 |
| HEICO Corp. | Tue Aug 25 | $1.57 |
| Intuit, Inc. | Tue Aug 25 | $4.02 |
| Zoom Communications, Inc. | Tue Aug 25 | $1.50 |
| Abercrombie & Fitch Co. | Wed Aug 26 | $2.82 |
| Kohl's Corp. | Wed Aug 26 | $0.05 |
| Agilent Technologies, Inc. | Wed Aug 26 | $1.71 |
| NVIDIA Corp. | Wed Aug 26 | $2.37 |
| Synopsys, Inc. | Wed Aug 26 | $4.00 |
| Best Buy Co., Inc. | Thu Aug 27 | $1.40 |
| Dollar General Corp. | Thu Aug 27 | $1.38 |
| Gap, Inc. | Thu Aug 27 | $0.80 |
| Marvell Technology, Inc. | Thu Aug 27 | $1.07 |
| Ulta Beauty, Inc. | Thu Aug 27 | $5.80 |
| Data Release | Date | Est. |
|---|---|---|
| Chicago Fed National Activity Index | Mon Aug 24 | 0.1 |
| Case-Shiller Composite 20 Home Price Index YoY | Tue Aug 25 | 2.4% |
| US New Single Family Houses Sold | Tue Aug 25 | 620.0K |
| Conference Board Consumer Confidence | Tue Aug 25 | 90.9 |
| US PCE Price Index YoY | Wed Aug 26 | 1.0% |
| US Durable Goods ex-Transportation New Orders MoM | Wed Aug 26 | 0.3% |
| Jackson Hole Economic Policy Symposium | Thu Aug 27 | N/A |
| Chicago PMI | Fri Aug 28 | 56.1 |
| US Index of Consumer Sentiment | Fri Aug 28 | 54.60 |
European equities moved lower on the fear of rising global bond yields spurred on by higher oil prices as the Iran/US wars which seemingly has no end in sight. The STOXX Europe 600 fell 0.6%, Germany's DAX declined 1.2%, France's CAC 40 fell 1.8%, while the UK's FTSE 100 gained 0.6%. Eurozone flash composite PMI improved to 52.1, while Germany's manufacturing output rose to its strongest level in more than four years.
Japanese equities declined sharply, with the Nikkei 225 down 3.9% and the TOPIX down 3.1%. Technology and semiconductor shares were pressured by higher global yields and renewed risk aversion. The 10-year JGB yield briefly reached a 30-year high near 2.93% before ending around 2.88%. Japan's second-quarter GDP slowed to 1.1% annualized, below expectations, while July core inflation accelerated to 1.8% y/y, reinforcing expectations for another BoJ rate increase.
Mainland Chinese equities weakened with the Shanghai Composite down 0.6% and the CSI 300 declining 1.0% as July data pointed to a slowdown. Industrial production slowed to 4.5% y/y, retail sales growth eased to 0.6%, fixed-asset investment contracted 6.7% through July, and real-estate investment fell 19.2%. Authorities continued to ease housing restrictions, but the data increased pressure for additional fiscal support. Hong Kong's Hang Seng Index was higher by 3.6%.
| Region | 1 Wk | 1 Mo | 3 Mo | YTD | 1 Yr | 3 Yr | 5 Yr |
|---|---|---|---|---|---|---|---|
| MSCI ACWI | -0.91% | +3.07% | +4.28% | +14.64% | +24.06% | +22.05% | +11.97% |
| MSCI ACWI ex USA | +0.09% | +4.33% | +5.45% | +17.40% | +27.79% | +21.38% | +10.23% |
| MSCI Emerging Markets | +1.24% | +4.33% | +3.46% | +24.22% | +38.90% | +24.18% | +9.73% |
| MSCI Europe Stock | +0.25% | +4.31% | +6.81% | +12.27% | +20.70% | +18.88% | +9.97% |
| MSCI Asia Pacific Stock | -0.31% | +4.07% | +4.38% | +23.16% | +33.52% | +23.47% | +10.17% |
| MSCI Latin America Stock | +3.03% | +0.43% | -0.29% | +14.08% | +36.75% | +14.86% | +11.76% |
| Rate | Latest | 1 Mo Ago | 1 Mo % | 1 Yr Ago | 1 Yr % |
|---|---|---|---|---|---|
| 1 Month Treasury | 3.80% | 3.75% | +1.3% | 4.49% | -15.4% |
| 2 Year Treasury | 4.24% | 4.26% | -0.5% | 3.79% | +11.9% |
| 10 Year Treasury | 4.74% | 4.63% | +2.4% | 4.33% | +9.5% |
| 30 Year Mortgage | 6.65% | 6.55% | +1.5% | 6.58% | +1.1% |
| US Corporate AAA | 5.30% | 5.22% | +1.5% | 4.72% | +12.3% |
| US Corporate BBB | 5.59% | 5.50% | +1.6% | 5.13% | +9.0% |
| US Corporate CCC | 14.61% | 13.98% | +4.5% | 11.93% | +22.5% |
| Effective Federal Funds | 3.63% | 3.63% | 0.0% | 4.33% | -16.2% |
| Indicator | Latest | 1 Mo Ago | 1 Mo % | 1 Yr Ago | 1 Yr % |
|---|---|---|---|---|---|
| Consumer Sentiment | 55.20 | 49.50 | +11.5% | 61.70 | -10.5% |
| Unemployment Rate | 4.10% | 4.20% | -2.4% | 4.30% | -4.7% |
| Inflation Rate | 3.40% | 3.50% | -2.9% | 2.70% | +25.9% |
| Manufacturing PMI | 55.60 | 53.30 | +4.3% | 48.00 | +15.8% |
| Non Manufacturing PMI | 54.10 | 54.00 | +0.2% | 50.10 | +8.0% |
| Retail Sales | 660,047 | 665,054 | -0.8% | 628,581 | +5.0% |
| Building Permits | 1,443 | 1,374 | +5.0% | 1,400 | +3.1% |
TEM has been in a downtrend for most of the past year since peaking slightly over $100 in October, 2025. It has strong support in the $40 range where it has bottomed multiple times over the past few months. Last week saw a gap higher that broke its downtrend line on a big spike in volume. We believe the stock is poised to challenge old highs near $100.
“We, no doubt, and it sort of states the obvious of seeing some incremental pressure on the consumer relative to the beginning of the year with higher fuel prices. As you go through month by month in the last quarter, you can tell when fuel prices increase and got above $4, and perhaps there's a psychological impact to that, that there are choices that consumers are making. So June was a little more obvious as we look at the quarter in terms of customers making trade-offs. And it's why we have leaned so heavily into lower prices.”
For our full list of Stocks To Consider, contact Patrick Mullin at pmullin@timberpointcapital.com
©2020 YCharts, Inc. All Rights Reserved. YCharts, Inc. ("YCharts") is not registered with the U.S. Securities and Exchange Commission as an investment adviser, broker-dealer or in any other capacity, and does not purport to provide investment advice or make investment recommendations. This report has been generated through application of the analytical tools and data provided through ycharts.com and is intended solely to assist you or your investment or other adviser(s) in conducting investment research.
All data, statistics and charts are courtesy of YCharts unless otherwise noted. Investment Advice is offered through Fortis Capital Advisors, LLC, 7301 Mission Road, Suite 326, Prairie Village, KS 66208.
While reasonable efforts were used to obtain information from sources believed to be reliable, Fortis Capital Advisors, LLC makes no representation that the information or opinions contained in this material are accurate, reliable, or complete. All information and opinions are subject to change without notice. You should not construe this report as an offer to buy or sell, as a solicitation of an offer to buy or sell, or as a recommendation to buy, sell, hold or trade, any security or other financial instrument.
Past performance is not indicative of future results. Investing involves risk, including the possible loss of principal. The information contained herein is provided for informational purposes only and should not be construed as investment, tax, or legal advice. Recipients should consult their own advisers before making any investment decisions.
Source: Timber Point Capital Management. Powered by Fortis Capital Advisors. Investment Advice is offered through Fortis Capital Advisors, LLC, 7301 Mission Road, Suite 326, Prairie Village, KS 66208. All rights reserved.