
The Week That Was
U.S. equities were broadly higher as investors absorbed the Federal Reserve's July policy meeting and a major rebound in selected AI-related technology shares following the liquidation of a major AI hedge fund, Situational Awareness, which sold its portfolio to Citadel after it was unable to meet margin calls. Nasdaq, DJIA, and SPX all advanced by more than 1%, while the S&P MidCap 400 declined by 0.67% and the R2K was little changed. Consumer discretionary led all S&P 500 sectors, up 6.1%, helped by Amazon's late-week rally, while utilities and real estate lagged, down 4% and 2%, respectively. Large cap growth equities rebounded, advancing by 2%, as mega cap growth names MSFT and AMZN both helped swing AI sentiment positive by reporting stronger than expected revenue growth for their respective cloud businesses, Azure and AWS. Results helped quell concerns over elevated AI related capex spend providing evidence that demand for high performance compute remains robust and that all capacity gains are quickly being consumed at still attractive prices and margins.
The FOMC meeting on Wednesday left the target range for the federal funds rate unchanged at 3.625% mid-point, but the commentary was hawkish with three policymakers dissenting in favor of a rate hike to quell inflation. Chair Kevin Warsh's policy of offering limited forward guidance has the market guessing on the next move and adding volatility to the yield curve. The curve steepened after the FOMC meeting as short-term yields eased while the 30-year Treasury yield moved above 5.2% for the first time since 2007. Core PCE prices were 3.3% higher than a year ago and versus 3.4% in May, while headline PCE remained well above the Fed's desired 2% level, at 3.7% annualized. Real GDP (first advanced estimate) increased at a 1.5% annualized rate in 2Q26, below expectations, and down from 2.1% in 1Q26. The deceleration reflected weaker government spending and slower growth in investment and exports, partly offset by stronger consumer spending. The Conference Board Consumer Confidence Index fell to 90.8 in July from 92.2 in June as a weaker business and labor market outlook dragged on sentiment.
Renewed Middle East tensions and concerns about crude supply disruptions pushed oil prices higher mid-week, with WTI crude moving to $84, before prices pulled back on hopes for new peace talks. The USD remained supported by the combination of higher U.S. yields, geopolitical uncertainty, and relative U.S. economic resilience with particular strength coming vs. the Japanese yen, which weakened toward multi-decade lows approaching JPY 164. Gold and other precious metals struggled as the rise in yields reduced the appeal of non-yielding assets.
U.S. Equity Market Summary — As of 7/31/26
| Asset Class | 1 Wk | 1 Mo | 3 Mo | YTD | 1 Yr | 3 Yr | 5 Yr |
|---|---|---|---|---|---|---|---|
| S&P 500 | 1.06% | -0.06% | 4.19% | 10.14% | 19.56% | 19.32% | 12.86% |
| Dow Jones Industrials Average | 1.04% | 0.38% | 6.13% | 10.17% | 20.91% | 15.94% | 10.57% |
| NASDAQ | 1.59% | -3.19% | 2.09% | 9.53% | 20.86% | 21.77% | 12.40% |
| S&P MidCap 400 | -0.67% | -2.38% | 3.60% | 14.54% | 20.92% | 12.96% | 8.47% |
| Russell 2000 | 0.05% | -3.03% | 4.99% | 18.85% | 34.18% | 15.09% | 7.11% |
| Russell Micro Cap | 0.40% | -6.01% | 5.06% | 19.84% | 45.98% | 19.34% | 6.96% |
U.S. Sector Summary — As of 7/31/26
| Cyclical Sectors | 1 Wk | 1 Mo | 3 Mo | YTD | 1 Yr | 3 Yr | 5 Yr |
|---|---|---|---|---|---|---|---|
| Consumer Cyclical | 6.11% | -1.01% | -1.71% | -2.39% | 5.67% | 11.04% | 6.04% |
| Financials | 1.12% | 6.21% | 9.61% | 4.86% | 10.40% | 19.10% | 11.19% |
| Materials | -1.62% | -0.79% | -1.65% | 12.11% | 17.05% | 7.61% | 5.79% |
| Real Estate | -1.92% | 2.36% | 2.39% | 13.42% | 12.56% | 9.32% | 2.80% |
| Sensitive Sectors | 1 Wk | 1 Mo | 3 Mo | YTD | 1 Yr | 3 Yr | 5 Yr |
|---|---|---|---|---|---|---|---|
| Comm. Services | 1.83% | 1.04% | -6.85% | -7.52% | 2.04% | 17.62% | 6.70% |
| Energy | -0.12% | 12.13% | 0.54% | 35.01% | 40.79% | 14.42% | 23.64% |
| Industrials | -1.54% | -2.91% | 3.26% | 16.54% | 19.82% | 19.35% | 13.41% |
| Technology | -0.30% | -7.96% | 10.07% | 22.09% | 34.17% | 26.11% | 18.87% |
| Defensive Sectors | 1 Wk | 1 Mo | 3 Mo | YTD | 1 Yr | 3 Yr | 5 Yr |
|---|---|---|---|---|---|---|---|
| Consumer Defensive | 1.09% | 2.38% | 1.58% | 10.87% | 9.58% | 6.79% | 6.29% |
| Health Care | -0.01% | 2.45% | 11.83% | 5.90% | 26.79% | 8.40% | 5.93% |
| Utilities | -4.19% | -2.18% | -4.73% | 5.27% | 6.40% | 13.10% | 9.33% |
US Equity Style Summary — As of 7/31/26
| Equity Style | 1 Wk | 1 Mo | 3 Mo | YTD | 1 Yr | 3 Yr | 5 Yr |
|---|---|---|---|---|---|---|---|
| Large Growth | 2.04% | -1.28% | 2.54% | 5.00% | 12.85% | 21.10% | 12.19% |
| Large Blend | 1.09% | -0.10% | 4.29% | 9.80% | 18.99% | 19.44% | 12.40% |
| Large Value | -0.52% | 0.99% | 6.89% | 16.37% | 26.82% | 17.02% | 12.29% |
| Mid Growth | 1.18% | -3.56% | 4.01% | 6.27% | 2.19% | 12.44% | 4.92% |
| Mid Blend | 0.47% | 0.44% | 4.97% | 12.36% | 14.97% | 14.20% | 7.78% |
| Mid Value | -0.04% | 3.58% | 5.64% | 16.65% | 24.94% | 15.12% | 10.17% |
| Small Growth | -0.34% | -6.99% | 1.65% | 12.96% | 21.03% | 13.06% | 4.07% |
| Small Blend | -0.04% | -2.61% | 4.02% | 15.16% | 23.81% | 13.83% | 7.40% |
| Small Value | 0.17% | 0.73% | 5.73% | 16.71% | 25.78% | 14.33% | 9.76% |
International Equity Market Summary — As of 7/31/26
The STOXX Europe 600 rose 0.7% and reached a new intraday high on Friday, supported by better-than-expected corporate earnings, a partial recovery in AI-related sentiment, and hopes for lower Brent crude prices. Germany's DAX gained 2.1%, France's CAC 40 rose 1.6% and the UK's FTSE 100 climbed 1.2%. Eurozone macro data were better than expected as GDP grew 0.4% q/q in 2Q26, ahead of expectations of 0.2%, helped by AI-related investment and government spending. Inflation ticked higher in July, with annual eurozone inflation rising to 2.9% from 2.8% in June. Services inflation increased to 3.3%, while non-energy industrial goods inflation rose to 0.9%. Germany's unemployment rate rose to 6.4% in July, but the economy expanded 0.2% sequentially in 2Q26, above expectations.
Japan declined modestly, with the Nikkei 225 down 0.4% and the TOPIX down 0.2%. The Bank of Japan left its policy rate unchanged at 1.0%, but its guidance kept a possible September move on the table as underlying inflation approaches the 2% target. The yen surged past JPY 160 per USD from the high JPY 163 range, raising speculation that authorities again intervened to support the currency. Tokyo-area core CPI rose 1.9% y/y in July, while retail sales slowed sharply in June.
China was mixed as the CSI 300 fell 1.3%, while the Shanghai Composite gained 0.5%. Mainland AI and semiconductor-related shares were pressured by the global sell-off in AI-linked names, although technology shares recovered somewhat late in the week. China's Politburo reaffirmed targeted policy support, including advanced technology and computing infrastructure, but did not announce a broad new stimulus program. Official PMI data softened, with manufacturing falling back into contraction at 49.2 and nonmanufacturing declining to 49.0. Hong Kong the clear regional outperformer, with the Hang Seng rising 3.7%.
| Region | 1 Wk | 1 Mo | 3 Mo | YTD | 1 Yr | 3 Yr | 5 Yr |
|---|---|---|---|---|---|---|---|
| MSCI ACWI | 1.36% | 0.10% | 4.50% | 11.60% | 22.59% | 18.82% | 11.35% |
| MSCI ACWI ex USA | 1.98% | 0.34% | 4.77% | 14.08% | 28.46% | 17.39% | 9.22% |
| MSCI Emerging Markets | 2.36% | -3.07% | 4.82% | 20.04% | 36.44% | 19.33% | 8.03% |
| MSCI Europe Stock | 1.82% | 1.61% | 5.25% | 9.54% | 22.73% | 15.63% | 9.45% |
| MSCI Asia Pacific Stock | 2.51% | -1.36% | 5.81% | 19.81% | 33.88% | 18.93% | 8.88% |
| MSCI Latin America Stock | 2.02% | 4.91% | -1.91% | 15.90% | 44.59% | 12.04% | 10.93% |
Chart of the Week — 8/3/26
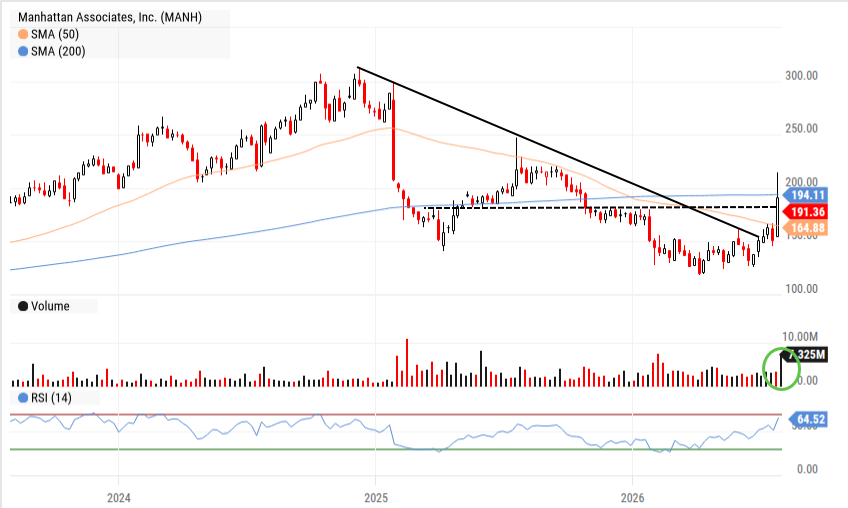
MANH has broken a multi-year downtrend and most recently gapped higher on big volume above a resistance area. We expect old resistance to become support for a move higher in the medium term.
The Week Ahead
The dog days of summer enter August with the SPX (~80 companies) wrapping up earnings season while the R2K is in full force with more than 800 companies set to report. Among notable names are PLTR, CAT, SNDK and WDC which were all, to varying degrees, caught up in the "tech wreck" last week owing to the liquidation of the Situational Awareness (SA) hedge fund. They and others hope to assuage investors that AI demand fundamentals, as well as supply in the memory space, remain positive after having bounced off lows later in the week following the SA news and strong MSFT and AMZN earnings. Consumer cyclicals will hope to keep their groove after a strong week with MAR, DASH, PLNT and TXRH all representing various angles of consumer demand that, interestingly, both V and MA called out as remaining strong at all income cohorts last week. Finally, the big kahuna in the healthcare space, LLY, will update investors on not only its remarkable obesity franchise but also detail its moves, both organic and via acquisition, into other therapeutic areas that could help drive both higher earnings growth and durability.
On the economic front, a big week of labor market data may test Fed Chair Warsh's characterization that the labor market is "stable" with an important read through from the reports for fixed income markets which have been on edge as of late. JOLTS data (Tues) will detail job openings which have bounced off the bottom the past two months highlighting labor market resilience while at the same time posting a lower quit rates suggesting that workers are not confident in finding the next job. Job openings have been strongest in the South and Midwest while the Northeast and West have posted declines. ADP employment (Wed) has posted three strong months of gains, averaging over 100K jobs gained in the past three months, after rather anemic results the prior six months. Education and healthcare services have been the strongest verticals. Rounding out the data is non-farm payrolls (Fri) which have been in a 4-month decline since peaking in March at 216K jobs added. June's gain of 57K jobs was led by professional/business services, social assistance and healthcare while leisure and hospitality were weak. Expectations for a rebound approaching 100K jobs added would likely be seen as not too hot, or too cold, and leave the fixed income market searching for additional data.
ISM PMI for Manufacturing (Mon) and Services (Wed) have both been robust with manufacturing now having posted 6 consecutive months above the 50.0 expansion mark while Services has been in expansion territory since mid '24. Finally, US productivity for 2Q26 is timely given the ongoing debate over AI spend and the resultant efficiency gains for the broader economy. Last quarter's (1Q26) 0.3% gain was a marked slowdown from the prior three-quarter average of almost 4%, which has been led by advances in manufacturing.
| Company | Date | EPS Est. |
|---|---|---|
| Marriott International, Inc. | Mon Aug 03 | $2.87 |
| Palantir Technologies, Inc. | Mon Aug 03 | $0.37 |
| Caterpillar, Inc. | Tue Aug 04 | $6.48 |
| McDonald's Corp. | Tue Aug 04 | $3.42 |
| Gilead Sciences, Inc. | Tue Aug 04 | $2.21 |
| The Walt Disney Co. | Wed Aug 05 | $1.77 |
| Eli Lilly & Co. | Wed Aug 05 | $9.48 |
| DoorDash, Inc. | Wed Aug 05 | $1.45 |
| Sandisk Corp. | Wed Aug 05 | $44.21 |
| Western Digital Corp. | Wed Aug 05 | $3.77 |
| Datadog, Inc. | Thu Aug 06 | $0.61 |
| Parker-Hannifin Corp. | Thu Aug 06 | $8.08 |
| Planet Fitness, Inc. | Thu Aug 06 | $0.79 |
| Microchip Technology, Inc. | Thu Aug 06 | $0.80 |
| Texas Roadhouse, Inc. | Thu Aug 06 | $1.32 |
| Vistra Corp. | Fri Aug 07 | $2.84 |
| Data Release | Date | Est. |
|---|---|---|
| US ISM Manufacturing PMI | Mon Aug 03 | 53.0 |
| US Construction Spending YoY | Mon Aug 03 | 1.0% |
| US Job Openings: Total Nonfarm | Tue Aug 04 | 7.3M |
| ADP Employment Change | Wed Aug 05 | 90.0K |
| US ISM Services PMI | Wed Aug 05 | 55.0 |
| US Challenger Job Cuts | Thu Aug 06 | 59.0K |
| US Productivity | Thu Aug 06 | 0.4% |
| US Nonfarm Payrolls MoM | Fri Aug 07 | 79.0K |
Key Interest Rates — As of 7/31/26
| Rate | As of | Latest | 1 Mo Ago | 1 Mo % | 1 Yr Ago | 1 Yr % |
|---|---|---|---|---|---|---|
| 1 Month Treasury | 7/31/26 | 3.78% | 3.70% | 2.2% | 4.49% | -15.8% |
| 2 Year Treasury | 7/31/26 | 4.28% | 4.14% | 3.4% | 3.94% | 8.6% |
| 10 Year Treasury | 7/31/26 | 4.75% | 4.44% | 7.0% | 4.37% | 8.7% |
| 30 Year Mortgage | 7/30/26 | 6.66% | 6.49% | 2.6% | 6.74% | -1.2% |
| US Corporate AAA | 7/30/26 | 5.32% | 5.05% | 5.3% | 4.84% | 9.9% |
| US Corporate BBB | 7/30/26 | 5.58% | 5.37% | 3.9% | 5.25% | 6.3% |
| US Corporate CCC | 7/30/26 | 14.29% | 13.90% | 2.8% | 12.32% | 16.0% |
| Effective Federal Funds | 7/30/26 | 3.63% | 3.63% | 0.0% | 4.33% | -16.2% |
US Economy Indicators
| Indicator | As of | Latest | 1 Mo Ago | 1 Mo % | 1 Yr Ago | 1 Yr % |
|---|---|---|---|---|---|---|
| Consumer Sentiment | 7/31/26 | 55.20 | 49.50 | 11.5% | 61.70 | -10.5% |
| Unemployment Rate | 6/30/26 | 4.20% | 4.30% | -2.3% | 4.10% | 2.4% |
| Inflation Rate | 6/30/26 | 3.50% | 3.80% | -7.9% | 2.70% | 29.6% |
| Manufacturing PMI | 6/30/26 | 53.30 | 52.70 | 1.1% | 49.00 | 8.8% |
| Non Manufacturing PMI | 6/30/26 | 54.00 | 53.60 | 0.7% | 50.80 | 6.3% |
| Retail Sales | 6/30/26 | 666,056 | 657,830 | 1.3% | 621,374 | 7.2% |
| Building Permits | 6/30/26 | 1,367 | 1,423 | -3.9% | 1,399 | -2.3% |
Suggested Readings
- 1Institute For The Study of War: Iran Update, August 2, 2026
- 2Situational Awareness: The Decade Ahead; Essays by Leopold Aschenbrenner
- 3Microsoft: Open Weights and American Leadership; July 24, 2026
- 4Anthropic: Our Position on Open Weight Models; July 27, 2026
- 5China's CXMT Is Set to Challenge DRAM: SemiAnalysis
Leadership Insight
“I don't know how to predict what inning we're in other than to say we've had very good deployment of the AI tools across the company, especially in product and engineering as I mentioned. We're getting good adoption in other parts of the company. I think we still have enormous opportunity ahead of us there, and we're just going to continue to lean in to using these tools to drive efficiency and effectiveness, shipping products better, faster and ultimately, better serving our clients in the ecosystem.”
Stocks to Watch
For our full list of Stocks To Consider, contact Patrick Mullin at pmullin@timberpointcapital.com
U.S. equities were broadly higher as investors absorbed the Federal Reserve's July policy meeting and a major rebound in selected AI-related technology shares following the liquidation of a major AI hedge fund, Situational Awareness, which sold its portfolio to Citadel after it was unable to meet margin calls. Nasdaq, DJIA, and SPX all advanced by more than 1%, while the S&P MidCap 400 declined by 0.67% and the R2K was little changed. Consumer discretionary led all S&P 500 sectors, up 6.1%, helped by Amazon's late-week rally, while utilities and real estate lagged, down 4% and 2%, respectively. Large cap growth equities rebounded, advancing by 2%, as mega cap growth names MSFT and AMZN both helped swing AI sentiment positive by reporting stronger than expected revenue growth for their respective cloud businesses, Azure and AWS. Results helped quell concerns over elevated AI related capex spend providing evidence that demand for high performance compute remains robust and that all capacity gains are quickly being consumed at still attractive prices and margins.
The FOMC meeting on Wednesday left the target range for the federal funds rate unchanged at 3.625% mid-point, but the commentary was hawkish with three policymakers dissenting in favor of a rate hike to quell inflation. Chair Kevin Warsh's policy of offering limited forward guidance has the market guessing on the next move and adding volatility to the yield curve. The curve steepened after the FOMC meeting as short-term yields eased while the 30-year Treasury yield moved above 5.2% for the first time since 2007. Core PCE prices were 3.3% higher than a year ago and versus 3.4% in May, while headline PCE remained well above the Fed's desired 2% level, at 3.7% annualized. Real GDP (first advanced estimate) increased at a 1.5% annualized rate in 2Q26, below expectations, and down from 2.1% in 1Q26. The deceleration reflected weaker government spending and slower growth in investment and exports, partly offset by stronger consumer spending. The Conference Board Consumer Confidence Index fell to 90.8 in July from 92.2 in June as a weaker business and labor market outlook dragged on sentiment.
Renewed Middle East tensions and concerns about crude supply disruptions pushed oil prices higher mid-week, with WTI crude moving to $84, before prices pulled back on hopes for new peace talks. The USD remained supported by the combination of higher U.S. yields, geopolitical uncertainty, and relative U.S. economic resilience with particular strength coming vs. the Japanese yen, which weakened toward multi-decade lows approaching JPY 164. Gold and other precious metals struggled as the rise in yields reduced the appeal of non-yielding assets.
| Asset Class | 1 Wk | 1 Mo | 3 Mo | YTD | 1 Yr | 3 Yr | 5 Yr |
|---|---|---|---|---|---|---|---|
| S&P 500 | 1.06% | -0.06% | 4.19% | 10.14% | 19.56% | 19.32% | 12.86% |
| Dow Jones Industrials Average | 1.04% | 0.38% | 6.13% | 10.17% | 20.91% | 15.94% | 10.57% |
| NASDAQ | 1.59% | -3.19% | 2.09% | 9.53% | 20.86% | 21.77% | 12.40% |
| S&P MidCap 400 | -0.67% | -2.38% | 3.60% | 14.54% | 20.92% | 12.96% | 8.47% |
| Russell 2000 | 0.05% | -3.03% | 4.99% | 18.85% | 34.18% | 15.09% | 7.11% |
| Russell Micro Cap | 0.40% | -6.01% | 5.06% | 19.84% | 45.98% | 19.34% | 6.96% |
| Sector | 1Wk | YTD |
|---|---|---|
| 6.11% | -2.39% | |
| 1.12% | 4.86% | |
| -1.62% | 12.11% | |
| -1.92% | 13.42% |
| Sector | 1Wk | YTD |
|---|---|---|
| 1.83% | -7.52% | |
| -0.12% | 35.01% | |
| -1.54% | 16.54% | |
| -0.30% | 22.09% |
| Sector | 1Wk | YTD |
|---|---|---|
| 1.09% | 10.87% | |
| -0.01% | 5.90% | |
| -4.19% | 5.27% |
| Style | 1 Wk | 1 Mo | 3 Mo | YTD | 1 Yr | 3 Yr | 5 Yr |
|---|---|---|---|---|---|---|---|
| Large Growth | 2.04% | -1.28% | 2.54% | 5.00% | 12.85% | 21.10% | 12.19% |
| Large Blend | 1.09% | -0.10% | 4.29% | 9.80% | 18.99% | 19.44% | 12.40% |
| Large Value | -0.52% | 0.99% | 6.89% | 16.37% | 26.82% | 17.02% | 12.29% |
| Mid Growth | 1.18% | -3.56% | 4.01% | 6.27% | 2.19% | 12.44% | 4.92% |
| Mid Blend | 0.47% | 0.44% | 4.97% | 12.36% | 14.97% | 14.20% | 7.78% |
| Mid Value | -0.04% | 3.58% | 5.64% | 16.65% | 24.94% | 15.12% | 10.17% |
| Small Growth | -0.34% | -6.99% | 1.65% | 12.96% | 21.03% | 13.06% | 4.07% |
| Small Blend | -0.04% | -2.61% | 4.02% | 15.16% | 23.81% | 13.83% | 7.40% |
| Small Value | 0.17% | 0.73% | 5.73% | 16.71% | 25.78% | 14.33% | 9.76% |
The dog days of summer enter August with the SPX (~80 companies) wrapping up earnings season while the R2K is in full force with more than 800 companies set to report. Among notable names are PLTR, CAT, SNDK and WDC which were all, to varying degrees, caught up in the "tech wreck" last week owing to the liquidation of the Situational Awareness (SA) hedge fund. They and others hope to assuage investors that AI demand fundamentals, as well as supply in the memory space, remain positive after having bounced off lows later in the week following the SA news and strong MSFT and AMZN earnings. Consumer cyclicals will hope to keep their groove after a strong week with MAR, DASH, PLNT and TXRH all representing various angles of consumer demand that, interestingly, both V and MA called out as remaining strong at all income cohorts last week. Finally, the big kahuna in the healthcare space, LLY, will update investors on not only its remarkable obesity franchise but also detail its moves, both organic and via acquisition, into other therapeutic areas that could help drive both higher earnings growth and durability.
On the economic front, a big week of labor market data may test Fed Chair Warsh's characterization that the labor market is "stable" with an important read through from the reports for fixed income markets which have been on edge as of late. JOLTS data (Tues) will detail job openings which have bounced off the bottom the past two months highlighting labor market resilience while at the same time posting a lower quit rates suggesting that workers are not confident in finding the next job. Job openings have been strongest in the South and Midwest while the Northeast and West have posted declines. ADP employment (Wed) has posted three strong months of gains, averaging over 100K jobs gained in the past three months, after rather anemic results the prior six months. Education and healthcare services have been the strongest verticals. Rounding out the data is non-farm payrolls (Fri) which have been in a 4-month decline since peaking in March at 216K jobs added. June's gain of 57K jobs was led by professional/business services, social assistance and healthcare while leisure and hospitality were weak. Expectations for a rebound approaching 100K jobs added would likely be seen as not too hot, or too cold, and leave the fixed income market searching for additional data.
ISM PMI for Manufacturing (Mon) and Services (Wed) have both been robust with manufacturing now having posted 6 consecutive months above the 50.0 expansion mark while Services has been in expansion territory since mid '24. Finally, US productivity for 2Q26 is timely given the ongoing debate over AI spend and the resultant efficiency gains for the broader economy. Last quarter's (1Q26) 0.3% gain was a marked slowdown from the prior three-quarter average of almost 4%, which has been led by advances in manufacturing.
| Company | Date | EPS Est. |
|---|---|---|
| Marriott International, Inc. | Mon Aug 03 | $2.87 |
| Palantir Technologies, Inc. | Mon Aug 03 | $0.37 |
| Caterpillar, Inc. | Tue Aug 04 | $6.48 |
| McDonald's Corp. | Tue Aug 04 | $3.42 |
| Gilead Sciences, Inc. | Tue Aug 04 | $2.21 |
| The Walt Disney Co. | Wed Aug 05 | $1.77 |
| Eli Lilly & Co. | Wed Aug 05 | $9.48 |
| DoorDash, Inc. | Wed Aug 05 | $1.45 |
| Sandisk Corp. | Wed Aug 05 | $44.21 |
| Western Digital Corp. | Wed Aug 05 | $3.77 |
| Datadog, Inc. | Thu Aug 06 | $0.61 |
| Parker-Hannifin Corp. | Thu Aug 06 | $8.08 |
| Planet Fitness, Inc. | Thu Aug 06 | $0.79 |
| Microchip Technology, Inc. | Thu Aug 06 | $0.80 |
| Texas Roadhouse, Inc. | Thu Aug 06 | $1.32 |
| Vistra Corp. | Fri Aug 07 | $2.84 |
| Data Release | Date | Est. |
|---|---|---|
| US ISM Manufacturing PMI | Mon Aug 03 | 53.0 |
| US Construction Spending YoY | Mon Aug 03 | 1.0% |
| US Job Openings: Total Nonfarm | Tue Aug 04 | 7.3M |
| ADP Employment Change | Wed Aug 05 | 90.0K |
| US ISM Services PMI | Wed Aug 05 | 55.0 |
| US Challenger Job Cuts | Thu Aug 06 | 59.0K |
| US Productivity | Thu Aug 06 | 0.4% |
| US Nonfarm Payrolls MoM | Fri Aug 07 | 79.0K |
The STOXX Europe 600 rose 0.7% and reached a new intraday high on Friday, supported by better-than-expected corporate earnings, a partial recovery in AI-related sentiment, and hopes for lower Brent crude prices. Germany's DAX gained 2.1%, France's CAC 40 rose 1.6% and the UK's FTSE 100 climbed 1.2%. Eurozone macro data were better than expected as GDP grew 0.4% q/q in 2Q26, ahead of expectations of 0.2%, helped by AI-related investment and government spending. Inflation ticked higher in July, with annual eurozone inflation rising to 2.9% from 2.8% in June. Services inflation increased to 3.3%, while non-energy industrial goods inflation rose to 0.9%. Germany's unemployment rate rose to 6.4% in July, but the economy expanded 0.2% sequentially in 2Q26, above expectations.
Japan declined modestly, with the Nikkei 225 down 0.4% and the TOPIX down 0.2%. The Bank of Japan left its policy rate unchanged at 1.0%, but its guidance kept a possible September move on the table as underlying inflation approaches the 2% target. The yen surged past JPY 160 per USD from the high JPY 163 range, raising speculation that authorities again intervened to support the currency. Tokyo-area core CPI rose 1.9% y/y in July, while retail sales slowed sharply in June.
China was mixed as the CSI 300 fell 1.3%, while the Shanghai Composite gained 0.5%. Mainland AI and semiconductor-related shares were pressured by the global sell-off in AI-linked names, although technology shares recovered somewhat late in the week. China's Politburo reaffirmed targeted policy support, including advanced technology and computing infrastructure, but did not announce a broad new stimulus program. Official PMI data softened, with manufacturing falling back into contraction at 49.2 and nonmanufacturing declining to 49.0. Hong Kong the clear regional outperformer, with the Hang Seng rising 3.7%.
| Region | 1 Wk | 1 Mo | 3 Mo | YTD | 1 Yr | 3 Yr | 5 Yr |
|---|---|---|---|---|---|---|---|
| MSCI ACWI | 1.36% | 0.10% | 4.50% | 11.60% | 22.59% | 18.82% | 11.35% |
| MSCI ACWI ex USA | 1.98% | 0.34% | 4.77% | 14.08% | 28.46% | 17.39% | 9.22% |
| MSCI Emerging Markets | 2.36% | -3.07% | 4.82% | 20.04% | 36.44% | 19.33% | 8.03% |
| MSCI Europe Stock | 1.82% | 1.61% | 5.25% | 9.54% | 22.73% | 15.63% | 9.45% |
| MSCI Asia Pacific Stock | 2.51% | -1.36% | 5.81% | 19.81% | 33.88% | 18.93% | 8.88% |
| MSCI Latin America Stock | 2.02% | 4.91% | -1.91% | 15.90% | 44.59% | 12.04% | 10.93% |
| Rate | Latest | 1 Mo Ago | 1 Mo % | 1 Yr Ago | 1 Yr % |
|---|---|---|---|---|---|
| 1 Month Treasury | 3.78% | 3.70% | 2.2% | 4.49% | -15.8% |
| 2 Year Treasury | 4.28% | 4.14% | 3.4% | 3.94% | 8.6% |
| 10 Year Treasury | 4.75% | 4.44% | 7.0% | 4.37% | 8.7% |
| 30 Year Mortgage | 6.66% | 6.49% | 2.6% | 6.74% | -1.2% |
| US Corporate AAA | 5.32% | 5.05% | 5.3% | 4.84% | 9.9% |
| US Corporate BBB | 5.58% | 5.37% | 3.9% | 5.25% | 6.3% |
| US Corporate CCC | 14.29% | 13.90% | 2.8% | 12.32% | 16.0% |
| Effective Federal Funds | 3.63% | 3.63% | 0.0% | 4.33% | -16.2% |
| Indicator | Latest | 1 Mo Ago | 1 Mo % | 1 Yr Ago | 1 Yr % |
|---|---|---|---|---|---|
| Consumer Sentiment | 55.20 | 49.50 | 11.5% | 61.70 | -10.5% |
| Unemployment Rate | 4.20% | 4.30% | -2.3% | 4.10% | 2.4% |
| Inflation Rate | 3.50% | 3.80% | -7.9% | 2.70% | 29.6% |
| Manufacturing PMI | 53.30 | 52.70 | 1.1% | 49.00 | 8.8% |
| Non Manufacturing PMI | 54.00 | 53.60 | 0.7% | 50.80 | 6.3% |
| Retail Sales | 666,056 | 657,830 | 1.3% | 621,374 | 7.2% |
| Building Permits | 1,367 | 1,423 | -3.9% | 1,399 | -2.3% |
MANH has broken a multi-year downtrend and most recently gapped higher on big volume above a resistance area. We expect old resistance to become support for a move higher in the medium term.
“I don't know how to predict what inning we're in other than to say we've had very good deployment of the AI tools across the company, especially in product and engineering as I mentioned. We're getting good adoption in other parts of the company. I think we still have enormous opportunity ahead of us there, and we're just going to continue to lean in to using these tools to drive efficiency and effectiveness, shipping products better, faster and ultimately, better serving our clients in the ecosystem.”
For our full list of Stocks To Consider, contact Patrick Mullin at pmullin@timberpointcapital.com
©2020 YCharts, Inc. All Rights Reserved. YCharts, Inc. ("YCharts") is not registered with the U.S. Securities and Exchange Commission as an investment adviser, broker-dealer or in any other capacity, and does not purport to provide investment advice or make investment recommendations. This report has been generated through application of the analytical tools and data provided through ycharts.com and is intended solely to assist you or your investment or other adviser(s) in conducting investment research.
All data, statistics and charts are courtesy of YCharts unless otherwise noted. Investment Advice is offered through Fortis Capital Advisors, LLC, 7301 Mission Road, Suite 326, Prairie Village, KS 66208.
While reasonable efforts were used to obtain information from sources believed to be reliable, Fortis Capital Advisors, LLC makes no representation that the information or opinions contained in this material are accurate, reliable, or complete. All information and opinions are subject to change without notice. You should not construe this report as an offer to buy or sell, as a solicitation of an offer to buy or sell, or as a recommendation to buy, sell, hold or trade, any security or other financial instrument.
Past performance is not indicative of future results. Investing involves risk, including the possible loss of principal. The information contained herein is provided for informational purposes only and should not be construed as investment, tax, or legal advice. Recipients should consult their own advisers before making any investment decisions.
Source: Timber Point Capital Management. Powered by Fortis Capital Advisors. Investment Advice is offered through Fortis Capital Advisors, LLC, 7301 Mission Road, Suite 326, Prairie Village, KS 66208. All rights reserved.