
The Week That Was
U.S. equities finished with modest gains at the headline level, but the advance was narrow. The S&P 500 gained 0.45%, the Dow Jones Industrial Average rose 0.49%, and the Nasdaq Composite advanced 0.83%, while the Russell 2000 fell 1.33%. Information technology (+1.93%) and communication services (+1.46%) led the S&P 500 sectors, while energy (-2.26%), health care (-2.23%), and industrials (-1.70%) lagged. The pattern reinforced a familiar 2026 theme: mega-cap technology and AI-related earnings strength continue to support the major averages even when breadth and economically sensitive areas soften.
NVDA was the week's dominant corporate catalyst. The company reported another strong quarter, with fiscal 2Q27 revenue up 106% y/y, and offered strong revenue guidance. Management's longer-range comments around fiscal 2028 revenue also came in well above analyst assumptions, helping restore confidence that hyperscaler and AI-infrastructure spending still has significant runway. Technology sentiment broadened further after strong software results, including CRM and CRWD, reinforced the idea that the AI investment cycle is moving from infrastructure build-out toward monetization and enterprise enablement.
Fed Chair Kevin Warsh used his Jackson Hole address to reiterate that the 2% PCE inflation target remains firm, that financial conditions do not appear particularly restrictive, and that additional tightening remains possible if inflation does not move clearly toward target. Markets interpreted the speech as hawkish as front-end Treasury yields rose and expectations for another rate hike increased. July core PCE rose 0.2% m/m and 3.3% y/y, in line with expectations, while headline PCE was slightly hotter at 3.7% y/y. Consumer confidence and sentiment weakened, underscoring the tension between resilient corporate earnings and a household sector still pressured by inflation.
The second estimate of second-quarter GDP remained at 1.5%, below expectations and down from 2.1% in the first quarter. Chicago PMI fell sharply to 47.1, signaling contraction in regional manufacturing activity while initial jobless claims remained low, suggesting layoffs have not yet accelerated materially.
Fixed income posted modest gains despite the Friday rate backup: the Bloomberg U.S. Aggregate Bond Index rose 0.46% for the week. Oil fell 4.3%, helped by hopes for improved energy flows through the Strait of Hormuz even as the U.S. intensified sanctions pressure on Iran. Gold and silver also declined while the dollar strengthened late Friday as markets repriced higher rates.
U.S. Equity Market Summary — As of 8/28/26
| Asset Class | 1 Wk | 1 Mo | 3 Mo | YTD | 1 Yr | 3 Yr | 5 Yr |
|---|---|---|---|---|---|---|---|
| S&P 500 | +0.50% | +3.91% | +2.24% | +13.51% | +20.01% | +21.87% | +12.93% |
| Dow Jones Industrials Average | +0.53% | +1.67% | +6.11% | +12.58% | +19.28% | +17.80% | +10.67% |
| NASDAQ | +0.85% | +6.19% | -1.77% | +14.03% | +22.37% | +25.27% | +12.60% |
| S&P MidCap 400 | -1.33% | -0.38% | +1.96% | +15.29% | +17.11% | +14.96% | +8.09% |
| Russell 2000 | -1.51% | +0.74% | +1.53% | +20.65% | +26.51% | +18.32% | +6.93% |
| Russell Micro Cap | -1.64% | +2.85% | +1.26% | +24.20% | +37.67% | +24.05% | +7.04% |
U.S. Sector Summary — As of 8/28/26
| Cyclical Sectors | 1 Wk | 1 Mo | 3 Mo | YTD | 1 Yr | 3 Yr | 5 Yr |
|---|---|---|---|---|---|---|---|
| Consumer Cyclical | -0.69% | +4.21% | -3.78% | -1.45% | +0.89% | +13.26% | +6.08% |
| Financials | +1.08% | +0.87% | +13.72% | +6.99% | +9.56% | +21.23% | +10.19% |
| Materials | -0.67% | +1.60% | +3.93% | +18.22% | +17.51% | +11.44% | +6.44% |
| Real Estate | -1.33% | -3.33% | +1.02% | +11.93% | +9.32% | +10.26% | +2.33% |
| Sensitive Sectors | 1 Wk | 1 Mo | 3 Mo | YTD | 1 Yr | 3 Yr | 5 Yr |
|---|---|---|---|---|---|---|---|
| Comm. Services | +1.43% | +3.03% | -2.90% | -3.46% | +2.51% | +20.87% | +7.02% |
| Energy | -1.51% | +8.88% | +10.85% | +42.10% | +43.75% | +16.08% | +24.96% |
| Industrials | -1.73% | -2.93% | +2.17% | +14.79% | +16.94% | +19.85% | +12.73% |
| Technology | +1.30% | +8.53% | -0.50% | +29.29% | +40.06% | +30.59% | +19.53% |
| Defensive Sectors | 1 Wk | 1 Mo | 3 Mo | YTD | 1 Yr | 3 Yr | 5 Yr |
|---|---|---|---|---|---|---|---|
| Consumer Defensive | -0.63% | -1.85% | +1.92% | +11.39% | +9.43% | +8.41% | +6.31% |
| Health Care | -1.98% | +2.33% | +13.94% | +11.51% | +27.64% | +10.40% | +6.63% |
| Utilities | -0.09% | -6.13% | -3.65% | +1.43% | +3.78% | +13.69% | +7.70% |
US Equity Style Summary — As of 8/28/26
| Equity Style | 1 Wk | 1 Mo | 3 Mo | YTD | 1 Yr | 3 Yr | 5 Yr |
|---|---|---|---|---|---|---|---|
| Large Growth | +0.78% | +5.79% | -1.49% | +8.54% | +14.93% | +23.97% | +12.17% |
| Large Blend | +0.51% | +3.97% | +2.38% | +13.26% | +19.72% | +22.08% | +12.52% |
| Large Value | +0.17% | +2.00% | +7.39% | +20.25% | +25.96% | +19.32% | +12.57% |
| Mid Growth | -1.16% | +2.02% | +1.96% | +10.55% | +6.74% | +15.62% | +5.07% |
| Mid Blend | -1.07% | +0.96% | +3.77% | +15.78% | +15.77% | +17.11% | +7.78% |
| Mid Value | -0.57% | +0.28% | +6.17% | +19.47% | +22.63% | +17.73% | +10.04% |
| Small Growth | -1.71% | +2.10% | -0.09% | +19.63% | +21.36% | +17.41% | +5.10% |
| Small Blend | -1.34% | +1.28% | +1.87% | +19.54% | +22.03% | +17.16% | +7.97% |
| Small Value | -1.02% | +0.56% | +3.77% | +19.44% | +22.65% | +16.99% | +10.03% |
International Equity Market Summary — As of 8/28/26
Improved European economic sentiment, lower oil prices, and the global spillover from U.S. AI earnings helped international equities marginally advance. The STOXX Europe 600 rose 0.15%, Germany's DAX gained 1.66%, France's CAC 40 fell 0.98%, and the UK's FTSE 100 was essentially unchanged.
Eurozone economic sentiment improved for a fourth consecutive month in August and reached its best level since January. Germany's second-quarter GDP was revised to 0.3%, better than expected, and the Ifo business climate index rose to a one-year high, reinforcing the view that Europe's largest economy may be emerging from stagnation. France was softer as 2Q26 GDP was revised to flat and annual inflation accelerated to 2.4% while UK retail survey data remained weak.
Japanese equities advanced as lower oil prices eased pressure on a major energy importer and strong NVDA results supported semiconductor sentiment. The Nikkei 225 rose 0.6% and the TOPIX gained 1.9%. The yen weakened toward JPY 160 per USD, while the 10-year JGB yield increased to 2.93% as investors continued to anticipate further BoJ tightening. Tokyo-area core inflation firmed and services producer-price inflation remained elevated, reinforcing the case for normalization.
Chinese equities were mixed as the Shanghai Composite rose 1.2%, while the CSI 300 fell 0.2% as AI and semiconductor shares rallied after NVIDIA's report, but technology shares were pressured early in the week by BABA's USD $10.2 billion equity placement to finance computing infrastructure, hyperscale AI data centers, and cloud investment. Hong Kong's Hang Seng declined 1.63%.
| Region | 1 Wk | 1 Mo | 3 Mo | YTD | 1 Yr | 3 Yr | 5 Yr |
|---|---|---|---|---|---|---|---|
| MSCI ACWI | +0.29% | +4.58% | +2.91% | +14.99% | +22.62% | +21.78% | +11.59% |
| MSCI ACWI ex USA | +0.01% | +5.84% | +3.78% | +17.41% | +27.54% | +20.83% | +9.66% |
| MSCI Emerging Markets | +0.05% | +9.02% | +0.52% | +24.28% | +39.16% | +23.40% | +8.83% |
| MSCI Europe Stock | -0.33% | +3.54% | +5.10% | +11.90% | +20.78% | +18.45% | +9.54% |
| MSCI Asia Pacific Stock | +0.39% | +8.35% | +2.44% | +23.64% | +33.67% | +22.84% | +9.53% |
| MSCI Latin America Stock | +0.17% | -0.15% | +0.39% | +14.27% | +31.30% | +13.65% | +10.66% |
Chart of the Week — 8/31/26
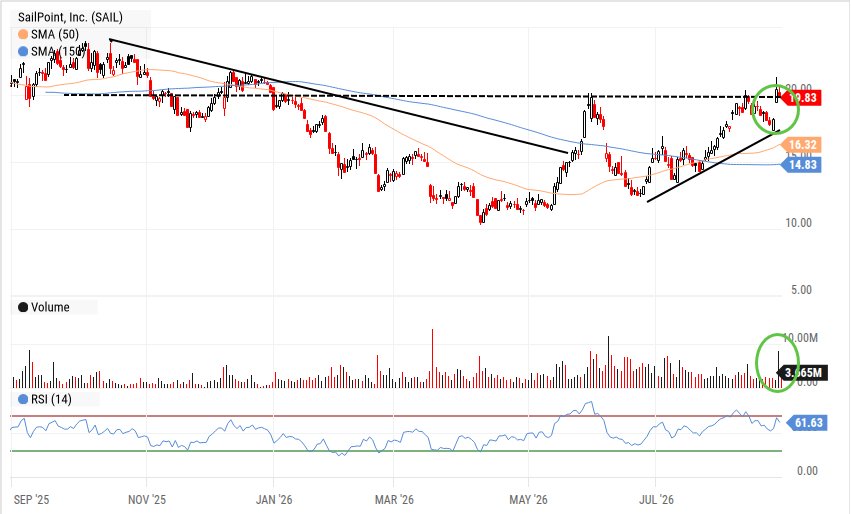
SAIL has been in a downtrend since its IPO in late '25 with very choppy price action. Its recent price move above $20 on a gap with big volume suggests that the short term uptrend in place since July '26 remains in place with the potential for a push toward old highs in the $25 area in the intermediate term.
The Week Ahead
Welcome to September with many investors hoping that the market this month does not meet the same fate as Djokovic last night at the US Open tennis. He looked nothing like his old self and reminds us that even the GOATs can struggle. For the market, strong corporate earnings are supporting equities, but the Federal Reserve remains focused on inflation. After Chair Warsh used Jackson Hole to push back against the idea that policy is meaningfully restrictive, the market has become more sensitive to every piece of labor market data. That makes Friday's August payroll employment report the most important event of the week.
The jobs report will include non-farm payrolls, the unemployment rate and average hourly earnings, and it arrives after July's surprising decline in payrolls. A modest rebound would probably be the most market-friendly outcome and evidence that the economy is strong but not so much to force the Fed toward another rate increase. A stronger-than-expected report, particularly if wage growth accelerates, would likely put upward pressure on Treasury yields and challenge rate-sensitive equities. Before Friday, investors will get several previews through JOLTS job openings, ADP private payrolls, jobless claims and the employment components of the ISM manufacturing and services surveys.
Inflation and growth signals will matter as well. ISM prices paid data, revised productivity and unit labor costs, the Fed's Beige Book and several Fed speakers will all help investors gauge the pace of economic growth. Internationally, central-bank decisions, eurozone inflation and Chinese manufacturing data will add another layer to the global policy picture.
On the corporate side, the AI trade remains front and center. Broadcom's results will provide an important follow-up to NVIDIA, with investors focused on custom AI accelerators, networking demand and hyperscaler capital spending. Dell and Hewlett Packard Enterprise will offer another read on AI-server demand, while Snowflake, Palo Alto Networks and Zscaler will help show whether the AI investment cycle is translating into stronger enterprise software and cybersecurity spending. Likewise, consumer spending trends will be in full evidence with reports from Five Below, Victoria's Secret and Lululemon.
As we move into a long weekend, strong earnings, especially tech/AI related, can hopefully continue to support the major averages, but broader participation likely requires some relief on rates. The best combination would be labor data that confirms gradual cooling, inflation indicators that do not reaccelerate, and continued evidence that AI-related spending remains durable. That is how a GOAT of a market will continue its winning ways.
| Company | Date | EPS Est. |
|---|---|---|
| Science Applications International Corp. | Mon Aug 31 | $2.38 |
| Medtronic Plc | Tue Sep 01 | $1.35 |
| Credo Technology Group Holding Ltd. | Tue Sep 01 | $1.26 |
| Dell Technologies, Inc. | Tue Sep 01 | $4.47 |
| MongoDB, Inc. | Tue Sep 01 | $1.51 |
| Palo Alto Networks, Inc. | Tue Sep 01 | $0.93 |
| Snowflake, Inc. | Wed Sep 02 | $0.52 |
| Broadcom Inc. | Wed Sep 02 | $3.88 |
| Five Below, Inc. | Wed Sep 02 | $0.86 |
| Hewlett Packard Enterprise Co. | Wed Sep 02 | $1.07 |
| NetApp, Inc. | Wed Sep 02 | $2.16 |
| Ciena Corp. | Thu Sep 03 | $1.82 |
| Victoria's Secret & Co. | Thu Sep 03 | $0.06 |
| DocuSign, Inc. | Thu Sep 03 | $1.16 |
| lululemon athletica, Inc. | Thu Sep 03 | $2.41 |
| Data Release | Date | Est. |
|---|---|---|
| US ISM Manufacturing PMI | Tue Sep 01 | 55.7 |
| US Job Openings: Total Nonfarm | Tue Sep 01 | 7.40M |
| ADP Employment Change | Wed Sep 02 | 59.0K |
| US Factory Orders MoM | Wed Sep 02 | -0.1% |
| US Challenger Job Cuts | Thu Sep 03 | 62.0K |
| US ISM Services PMI | Thu Sep 03 | 53.8 |
| US Nonfarm Payrolls MoM | Fri Sep 04 | 12.0K |
| US Unemployment Rate | Fri Sep 04 | 4.20% |
| US Index of Consumer Sentiment | Fri Sep 04 | 54.60 |
Key Interest Rates — As of 8/28/26
| Rate | As of | Latest | 1 Mo Ago | 1 Mo % | 1 Yr Ago | 1 Yr % |
|---|---|---|---|---|---|---|
| 1 Month Treasury | 8/28/26 | 3.84% | 3.76% | +2.1% | 4.42% | -13.1% |
| 2 Year Treasury | 8/28/26 | 4.34% | 4.26% | +1.9% | 3.62% | +19.9% |
| 10 Year Treasury | 8/28/26 | 4.73% | 4.61% | +2.6% | 4.22% | +12.1% |
| 30 Year Mortgage | 8/27/26 | 6.66% | 6.58% | +1.2% | 6.58% | +1.2% |
| US Corporate AAA | 8/27/26 | 5.27% | 5.31% | -0.8% | 4.69% | +12.4% |
| US Corporate BBB | 8/27/26 | 5.56% | 5.59% | -0.5% | 5.08% | +9.4% |
| US Corporate CCC | 8/27/26 | 14.58% | 14.32% | +1.8% | 11.46% | +27.2% |
| Effective Federal Funds | 8/27/26 | 3.63% | 3.63% | 0.0% | 4.33% | -16.2% |
US Economy Indicators
| Indicator | As of | Latest | 1 Mo Ago | 1 Mo % | 1 Yr Ago | 1 Yr % |
|---|---|---|---|---|---|---|
| Consumer Sentiment | 7/31/26 | 55.20 | 49.50 | +11.5% | 61.70 | -10.5% |
| Unemployment Rate | 7/31/26 | 4.10% | 4.20% | -2.4% | 4.30% | -4.7% |
| Inflation Rate | 7/31/26 | 3.40% | 3.50% | -2.9% | 2.70% | +25.9% |
| Manufacturing PMI | 7/31/26 | 55.60 | 53.30 | +4.3% | 48.00 | +15.8% |
| Non Manufacturing PMI | 7/31/26 | 54.10 | 54.00 | +0.2% | 50.10 | +8.0% |
| Retail Sales | 7/31/26 | 660,047 | 665,054 | -0.8% | 628,581 | +5.0% |
| Building Permits | 7/31/26 | 1,443 | 1,374 | +5.0% | 1,400 | +3.1% |
Suggested Readings
- 1Institute For The Study of War: Iran Update Special Report, August 28, 2026
- 2In Our Time: Fed Chair Warsh Speech at Jackson Hole, Wyoming on August 28, 2026
- 3Nvidia's AI Advantage is Moving Beyond the GPU
- 4US Senate Map Trending Toward Democrats, Though GOP Retains Slim Advantage
- 5Trump Tried To Curb Clean Energy. It's Booming Anyway.
Leadership Insight
“Incredibly, we are seeing demand acceleration even at our scale. Customers' forecasts point to our growth doubling next year. However, as I mentioned earlier, we expect to grow approximately 70% as we are supply-constrained. NVIDIA compute is fully utilized across every cloud we serve. The economic value it generates for our hyperscale, neocloud, and AI lab partners keeps rising.”
Stocks to Watch
For our full list of Stocks To Consider, contact Patrick Mullin at pmullin@timberpointcapital.com
U.S. equities finished with modest gains at the headline level, but the advance was narrow. The S&P 500 gained 0.45%, the Dow Jones Industrial Average rose 0.49%, and the Nasdaq Composite advanced 0.83%, while the Russell 2000 fell 1.33%. Information technology (+1.93%) and communication services (+1.46%) led the S&P 500 sectors, while energy (-2.26%), health care (-2.23%), and industrials (-1.70%) lagged. The pattern reinforced a familiar 2026 theme: mega-cap technology and AI-related earnings strength continue to support the major averages even when breadth and economically sensitive areas soften.
NVDA was the week's dominant corporate catalyst. The company reported another strong quarter, with fiscal 2Q27 revenue up 106% y/y, and offered strong revenue guidance. Management's longer-range comments around fiscal 2028 revenue also came in well above analyst assumptions, helping restore confidence that hyperscaler and AI-infrastructure spending still has significant runway. Technology sentiment broadened further after strong software results, including CRM and CRWD, reinforced the idea that the AI investment cycle is moving from infrastructure build-out toward monetization and enterprise enablement.
Fed Chair Kevin Warsh used his Jackson Hole address to reiterate that the 2% PCE inflation target remains firm, that financial conditions do not appear particularly restrictive, and that additional tightening remains possible if inflation does not move clearly toward target. Markets interpreted the speech as hawkish as front-end Treasury yields rose and expectations for another rate hike increased. July core PCE rose 0.2% m/m and 3.3% y/y, in line with expectations, while headline PCE was slightly hotter at 3.7% y/y.
The second estimate of second-quarter GDP remained at 1.5%, below expectations and down from 2.1% in the first quarter. Chicago PMI fell sharply to 47.1, signaling contraction in regional manufacturing activity while initial jobless claims remained low, suggesting layoffs have not yet accelerated materially.
Fixed income posted modest gains despite the Friday rate backup: the Bloomberg U.S. Aggregate Bond Index rose 0.46% for the week. Oil fell 4.3%, helped by hopes for improved energy flows through the Strait of Hormuz even as the U.S. intensified sanctions pressure on Iran. Gold and silver also declined while the dollar strengthened late Friday as markets repriced higher rates.
| Asset Class | 1 Wk | 1 Mo | 3 Mo | YTD | 1 Yr | 3 Yr | 5 Yr |
|---|---|---|---|---|---|---|---|
| S&P 500 | +0.50% | +3.91% | +2.24% | +13.51% | +20.01% | +21.87% | +12.93% |
| Dow Jones Industrials Average | +0.53% | +1.67% | +6.11% | +12.58% | +19.28% | +17.80% | +10.67% |
| NASDAQ | +0.85% | +6.19% | -1.77% | +14.03% | +22.37% | +25.27% | +12.60% |
| S&P MidCap 400 | -1.33% | -0.38% | +1.96% | +15.29% | +17.11% | +14.96% | +8.09% |
| Russell 2000 | -1.51% | +0.74% | +1.53% | +20.65% | +26.51% | +18.32% | +6.93% |
| Russell Micro Cap | -1.64% | +2.85% | +1.26% | +24.20% | +37.67% | +24.05% | +7.04% |
| Sector | 1Wk | YTD |
|---|---|---|
| -0.69% | -1.45% | |
| +1.08% | +6.99% | |
| -0.67% | +18.22% | |
| -1.33% | +11.93% |
| Sector | 1Wk | YTD |
|---|---|---|
| +1.43% | -3.46% | |
| -1.51% | +42.10% | |
| -1.73% | +14.79% | |
| +1.30% | +29.29% |
| Sector | 1Wk | YTD |
|---|---|---|
| -0.63% | +11.39% | |
| -1.98% | +11.51% | |
| -0.09% | +1.43% |
| Style | 1 Wk | 1 Mo | 3 Mo | YTD | 1 Yr | 3 Yr | 5 Yr |
|---|---|---|---|---|---|---|---|
| Large Growth | +0.78% | +5.79% | -1.49% | +8.54% | +14.93% | +23.97% | +12.17% |
| Large Blend | +0.51% | +3.97% | +2.38% | +13.26% | +19.72% | +22.08% | +12.52% |
| Large Value | +0.17% | +2.00% | +7.39% | +20.25% | +25.96% | +19.32% | +12.57% |
| Mid Growth | -1.16% | +2.02% | +1.96% | +10.55% | +6.74% | +15.62% | +5.07% |
| Mid Blend | -1.07% | +0.96% | +3.77% | +15.78% | +15.77% | +17.11% | +7.78% |
| Mid Value | -0.57% | +0.28% | +6.17% | +19.47% | +22.63% | +17.73% | +10.04% |
| Small Growth | -1.71% | +2.10% | -0.09% | +19.63% | +21.36% | +17.41% | +5.10% |
| Small Blend | -1.34% | +1.28% | +1.87% | +19.54% | +22.03% | +17.16% | +7.97% |
| Small Value | -1.02% | +0.56% | +3.77% | +19.44% | +22.65% | +16.99% | +10.03% |
Welcome to September with many investors hoping that the market this month does not meet the same fate as Djokovic last night at the US Open tennis. He looked nothing like his old self and reminds us that even the GOATs can struggle. For the market, strong corporate earnings are supporting equities, but the Federal Reserve remains focused on inflation. After Chair Warsh used Jackson Hole to push back against the idea that policy is meaningfully restrictive, the market has become more sensitive to every piece of labor market data. That makes Friday's August payroll employment report the most important event of the week.
The jobs report will include non-farm payrolls, the unemployment rate and average hourly earnings, and it arrives after July's surprising decline in payrolls. A modest rebound would probably be the most market-friendly outcome. A stronger-than-expected report, particularly if wage growth accelerates, would likely put upward pressure on Treasury yields and challenge rate-sensitive equities. Before Friday, investors will get several previews through JOLTS job openings, ADP private payrolls, jobless claims and the employment components of the ISM manufacturing and services surveys.
On the corporate side, the AI trade remains front and center. Broadcom's results will provide an important follow-up to NVIDIA, with investors focused on custom AI accelerators, networking demand and hyperscaler capital spending. Dell and Hewlett Packard Enterprise will offer another read on AI-server demand, while Snowflake, Palo Alto Networks and Zscaler will help show whether the AI investment cycle is translating into stronger enterprise software and cybersecurity spending.
As we move into a long weekend, strong earnings, especially tech/AI related, can hopefully continue to support the major averages, but broader participation likely requires some relief on rates. The best combination would be labor data that confirms gradual cooling, inflation indicators that do not reaccelerate, and continued evidence that AI-related spending remains durable. That is how a GOAT of a market will continue its winning ways.
| Company | Date | EPS Est. |
|---|---|---|
| Science Applications International Corp. | Mon Aug 31 | $2.38 |
| Medtronic Plc | Tue Sep 01 | $1.35 |
| Credo Technology Group Holding Ltd. | Tue Sep 01 | $1.26 |
| Dell Technologies, Inc. | Tue Sep 01 | $4.47 |
| MongoDB, Inc. | Tue Sep 01 | $1.51 |
| Palo Alto Networks, Inc. | Tue Sep 01 | $0.93 |
| Snowflake, Inc. | Wed Sep 02 | $0.52 |
| Broadcom Inc. | Wed Sep 02 | $3.88 |
| Five Below, Inc. | Wed Sep 02 | $0.86 |
| Hewlett Packard Enterprise Co. | Wed Sep 02 | $1.07 |
| NetApp, Inc. | Wed Sep 02 | $2.16 |
| Ciena Corp. | Thu Sep 03 | $1.82 |
| Victoria's Secret & Co. | Thu Sep 03 | $0.06 |
| DocuSign, Inc. | Thu Sep 03 | $1.16 |
| lululemon athletica, Inc. | Thu Sep 03 | $2.41 |
| Data Release | Date | Est. |
|---|---|---|
| US ISM Manufacturing PMI | Tue Sep 01 | 55.7 |
| US Job Openings: Total Nonfarm | Tue Sep 01 | 7.40M |
| ADP Employment Change | Wed Sep 02 | 59.0K |
| US Factory Orders MoM | Wed Sep 02 | -0.1% |
| US Challenger Job Cuts | Thu Sep 03 | 62.0K |
| US ISM Services PMI | Thu Sep 03 | 53.8 |
| US Nonfarm Payrolls MoM | Fri Sep 04 | 12.0K |
| US Unemployment Rate | Fri Sep 04 | 4.20% |
| US Index of Consumer Sentiment | Fri Sep 04 | 54.60 |
Improved European economic sentiment, lower oil prices, and the global spillover from U.S. AI earnings helped international equities marginally advance. The STOXX Europe 600 rose 0.15%, Germany's DAX gained 1.66%, France's CAC 40 fell 0.98%, and the UK's FTSE 100 was essentially unchanged.
Eurozone economic sentiment improved for a fourth consecutive month in August and reached its best level since January. Germany's second-quarter GDP was revised to 0.3%, better than expected, and the Ifo business climate index rose to a one-year high, reinforcing the view that Europe's largest economy may be emerging from stagnation. France was softer as 2Q26 GDP was revised to flat and annual inflation accelerated to 2.4% while UK retail survey data remained weak.
Japanese equities advanced as lower oil prices eased pressure on a major energy importer and strong NVDA results supported semiconductor sentiment. The Nikkei 225 rose 0.6% and the TOPIX gained 1.9%. The yen weakened toward JPY 160 per USD, while the 10-year JGB yield increased to 2.93% as investors continued to anticipate further BoJ tightening.
Chinese equities were mixed as the Shanghai Composite rose 1.2%, while the CSI 300 fell 0.2% as AI and semiconductor shares rallied after NVIDIA's report, but technology shares were pressured early in the week by BABA's USD $10.2 billion equity placement. Hong Kong's Hang Seng declined 1.63%.
| Region | 1 Wk | 1 Mo | 3 Mo | YTD | 1 Yr | 3 Yr | 5 Yr |
|---|---|---|---|---|---|---|---|
| MSCI ACWI | +0.29% | +4.58% | +2.91% | +14.99% | +22.62% | +21.78% | +11.59% |
| MSCI ACWI ex USA | +0.01% | +5.84% | +3.78% | +17.41% | +27.54% | +20.83% | +9.66% |
| MSCI Emerging Markets | +0.05% | +9.02% | +0.52% | +24.28% | +39.16% | +23.40% | +8.83% |
| MSCI Europe Stock | -0.33% | +3.54% | +5.10% | +11.90% | +20.78% | +18.45% | +9.54% |
| MSCI Asia Pacific Stock | +0.39% | +8.35% | +2.44% | +23.64% | +33.67% | +22.84% | +9.53% |
| MSCI Latin America Stock | +0.17% | -0.15% | +0.39% | +14.27% | +31.30% | +13.65% | +10.66% |
| Rate | Latest | 1 Mo Ago | 1 Mo % | 1 Yr Ago | 1 Yr % |
|---|---|---|---|---|---|
| 1 Month Treasury | 3.84% | 3.76% | +2.1% | 4.42% | -13.1% |
| 2 Year Treasury | 4.34% | 4.26% | +1.9% | 3.62% | +19.9% |
| 10 Year Treasury | 4.73% | 4.61% | +2.6% | 4.22% | +12.1% |
| 30 Year Mortgage | 6.66% | 6.58% | +1.2% | 6.58% | +1.2% |
| US Corporate AAA | 5.27% | 5.31% | -0.8% | 4.69% | +12.4% |
| US Corporate BBB | 5.56% | 5.59% | -0.5% | 5.08% | +9.4% |
| US Corporate CCC | 14.58% | 14.32% | +1.8% | 11.46% | +27.2% |
| Effective Federal Funds | 3.63% | 3.63% | 0.0% | 4.33% | -16.2% |
| Indicator | Latest | 1 Mo Ago | 1 Mo % | 1 Yr Ago | 1 Yr % |
|---|---|---|---|---|---|
| Consumer Sentiment | 55.20 | 49.50 | +11.5% | 61.70 | -10.5% |
| Unemployment Rate | 4.10% | 4.20% | -2.4% | 4.30% | -4.7% |
| Inflation Rate | 3.40% | 3.50% | -2.9% | 2.70% | +25.9% |
| Manufacturing PMI | 55.60 | 53.30 | +4.3% | 48.00 | +15.8% |
| Non Manufacturing PMI | 54.10 | 54.00 | +0.2% | 50.10 | +8.0% |
| Retail Sales | 660,047 | 665,054 | -0.8% | 628,581 | +5.0% |
| Building Permits | 1,443 | 1,374 | +5.0% | 1,400 | +3.1% |
SAIL has been in a downtrend since its IPO in late '25 with very choppy price action. Its recent price move above $20 on a gap with big volume suggests that the short term uptrend in place since July '26 remains in place with the potential for a push toward old highs in the $25 area in the intermediate term.
“Incredibly, we are seeing demand acceleration even at our scale. Customers' forecasts point to our growth doubling next year. However, as I mentioned earlier, we expect to grow approximately 70% as we are supply-constrained. NVIDIA compute is fully utilized across every cloud we serve. The economic value it generates for our hyperscale, neocloud, and AI lab partners keeps rising.”
For our full list of Stocks To Consider, contact Patrick Mullin at pmullin@timberpointcapital.com
©2020 YCharts, Inc. All Rights Reserved. YCharts, Inc. ("YCharts") is not registered with the U.S. Securities and Exchange Commission as an investment adviser, broker-dealer or in any other capacity, and does not purport to provide investment advice or make investment recommendations. This report has been generated through application of the analytical tools and data provided through ycharts.com and is intended solely to assist you or your investment or other adviser(s) in conducting investment research.
All data, statistics and charts are courtesy of YCharts unless otherwise noted. Investment Advice is offered through Fortis Capital Advisors, LLC, 7301 Mission Road, Suite 326, Prairie Village, KS 66208.
While reasonable efforts were used to obtain information from sources believed to be reliable, Fortis Capital Advisors, LLC makes no representation that the information or opinions contained in this material are accurate, reliable, or complete. All information and opinions are subject to change without notice. You should not construe this report as an offer to buy or sell, as a solicitation of an offer to buy or sell, or as a recommendation to buy, sell, hold or trade, any security or other financial instrument.
Past performance is not indicative of future results. Investing involves risk, including the possible loss of principal. The information contained herein is provided for informational purposes only and should not be construed as investment, tax, or legal advice. Recipients should consult their own advisers before making any investment decisions.
Source: Timber Point Capital Management. Powered by Fortis Capital Advisors. Investment Advice is offered through Fortis Capital Advisors, LLC, 7301 Mission Road, Suite 326, Prairie Village, KS 66208. All rights reserved.